Progressive neuronal and motor dysfunction in mice overexpressing the serine protease inhibitor protease nexin-1 in postmitotic neurons
- PMID: 11698595
- PMCID: PMC6762270
- DOI: 10.1523/JNEUROSCI.21-22-08830.2001
Progressive neuronal and motor dysfunction in mice overexpressing the serine protease inhibitor protease nexin-1 in postmitotic neurons
Abstract
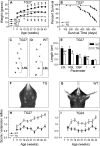
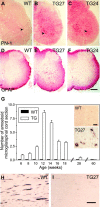
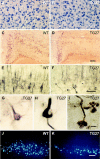
Perturbation of the homeostasis between proteases and their inhibitors has been associated with lesion-induced or degenerative neuronal changes. Protease nexin-1 (PN-1), a secreted serine protease inhibitor, is constitutively expressed in distinct neuronal cell populations of the adult CNS. In an earlier study we showed that transgenic mice with ectopic or increased expression of PN-1 in postnatal neurons have altered synaptic transmission. Here these mice are used to examine the impact of an extracellular proteolytic imbalance on long-term neuronal function. These mice develop disturbances in motor behavior from 12 weeks on, with some of the histopathological changes described in early stages of human motor neuron disease, and neurogenic muscle atrophy in old age. In addition, sensorimotor integration, measured by epicranial multichannel recording of sensory evoked potentials, is impaired. Our results suggest that axonal dysfunction rather than cell death underlies these phenotypes. In particular, long projecting neurons, namely cortical layer V pyramidal and spinal motor neurons, show an age-dependent vulnerability to PN-1 overexpression. These mice can serve to study early stages of in vivo neuronal dysfunction not yet associated with cell loss.
Figures


Similar articles
-
Endogenous serine protease inhibitor modulates epileptic activity and hippocampal long-term potentiation.J Neurosci. 1997 Jun 15;17(12):4688-99. doi: 10.1523/JNEUROSCI.17-12-04688.1997. J Neurosci. 1997. PMID: 9169529 Free PMC article.
-
Protease nexin-1 is expressed at the mouse met-/mesencephalic junction and FGF signaling regulates its promoter activity in primary met-/mesencephalic cells.Development. 1997 Mar;124(6):1251-62. doi: 10.1242/dev.124.6.1251. Development. 1997. PMID: 9102311
-
The role of serine proteases and serine protease inhibitors in the migration of gonadotropin-releasing hormone neurons.BMC Dev Biol. 2002;2:1. doi: 10.1186/1471-213x-2-1. Epub 2002 Feb 5. BMC Dev Biol. 2002. PMID: 11872147 Free PMC article.
-
Platelet protease nexin-2/amyloid beta-protein precursor. Possible pathologic and physiologic functions.Ann N Y Acad Sci. 1991;640:140-4. doi: 10.1111/j.1749-6632.1991.tb00205.x. Ann N Y Acad Sci. 1991. PMID: 1776731 Review.
-
Regulation of neuronal cells and astrocytes by protease nexin-1 and thrombin.Ann N Y Acad Sci. 1992 Dec 31;674:228-36. doi: 10.1111/j.1749-6632.1992.tb27491.x. Ann N Y Acad Sci. 1992. PMID: 1288365 Review. No abstract available.
Cited by
-
Regulation of brain proteolytic activity is necessary for the in vivo function of NMDA receptors.J Neurosci. 2004 Oct 27;24(43):9734-43. doi: 10.1523/JNEUROSCI.3306-04.2004. J Neurosci. 2004. PMID: 15509762 Free PMC article.
-
Neuron-generated thrombin induces a protective astrocyte response via protease activated receptors.Glia. 2020 Feb;68(2):246-262. doi: 10.1002/glia.23714. Epub 2019 Aug 27. Glia. 2020. PMID: 31453648 Free PMC article.
-
Constitutive secretion of protease nexin-1 by glial cells and its regulation by G-protein-coupled receptors.J Neurosci. 2005 Sep 28;25(39):8995-9004. doi: 10.1523/JNEUROSCI.2430-05.2005. J Neurosci. 2005. PMID: 16192390 Free PMC article.
-
Mice lacking protease nexin-1 show delayed structural and functional recovery after sciatic nerve crush.J Neurosci. 2007 Apr 4;27(14):3677-85. doi: 10.1523/JNEUROSCI.0277-07.2007. J Neurosci. 2007. PMID: 17409231 Free PMC article.
-
Formation of the Mouse Internal Capsule and Cerebral Peduncle: A Pioneering Role for Striatonigral Axons as Revealed in Isl1 Conditional Mutants.J Neurosci. 2022 Apr 20;42(16):3344-3364. doi: 10.1523/JNEUROSCI.2291-21.2022. Epub 2022 Mar 10. J Neurosci. 2022. PMID: 35273083 Free PMC article.
References
-
- Anderson JR. Atlas of skeletal muscle pathology. MTP; Lancaster, UK: 1985.
-
- Baker JB, Low DA, Simmer RL, Cunningham DD. Protease-nexin: a cellular component that links thrombin and plasminogen activator and mediates their binding to cells. Cell. 1980;21:37–45. - PubMed
-
- Barnéoud P, Lolivier J, Sanger DJ, Scatton B, Moser P. Quantitative motor assessment in FALS mice: a longitudinal study. NeuroReport. 1997;8:2861–2865. - PubMed
-
- Campbell MJ, Morrison JH. Monoclonal antibody to neurofilament protein (SMI-32) labels a subpopulation of pyramidal neurons in the human and monkey neocortex. J Comp Neurol. 1989;282:191–205. - PubMed
-
- Caroni P. Overexpression of growth-associated proteins in the neurons of adult transgenic mice. J Neurosci Methods. 1997;71:3–9. - PubMed
Publication types
MeSH terms
Substances
LinkOut - more resources
Full Text Sources
Molecular Biology Databases
Miscellaneous
