. 2001 Nov 15;21(22):8906-14.
doi: 10.1523/JNEUROSCI.21-22-08906.2001.

Spontaneous activity in developing ferret visual cortex in vivo

Affiliations

Spontaneous activity in developing ferret visual cortex in vivo

C Chiu et al. J Neurosci. .

Abstract

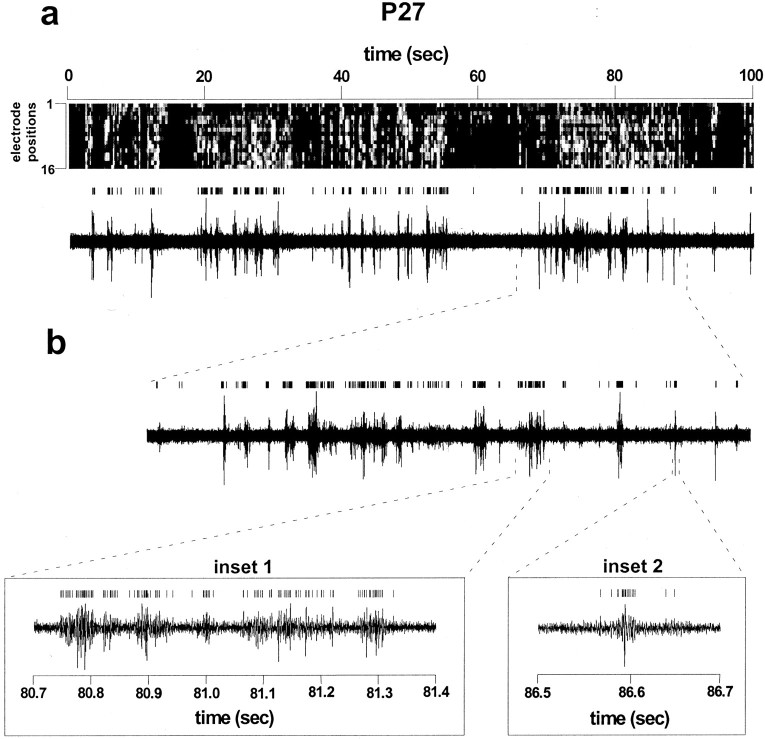
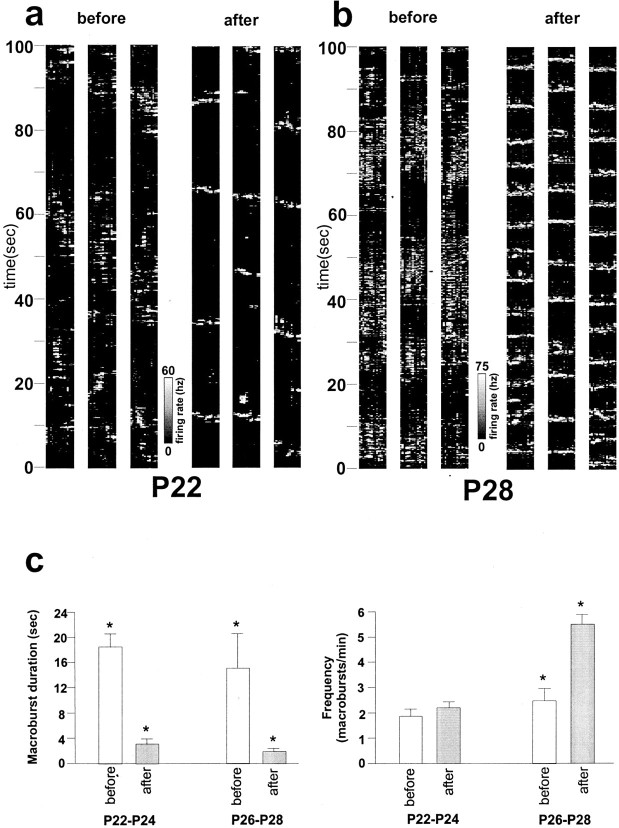
Multi-electrode extracellular recordings in area 17 of awake behaving ferrets were conducted to characterize the pattern of spontaneous activity in the developing visual cortex before eye opening. A linear array of 16 microwire electrodes was used to record extracellular neuronal activity across a 3.2 mm strip of visual cortex between postnatal days 22 and 28. Whereas synchronous bursts of activity were observed at all recording sites, cross-correlation analysis revealed that the timing of spike activity at all electrodes was not precisely correlated. Correlated activity between cortical sites exhibited a patchy organization having long-range components. Long-range correlated activity was observed between cortical patches that were separated by a mean distance of 1 mm. The spatial pattern of correlated activity persisted during transient lateral geniculate nucleus (LGN) activity block, indicating that long-range correlated activity is generated by intrinsic circuits within the cortex, independent of LGN input activity. These results demonstrate an innate patchy organization of correlated spontaneous activity within the cortex during the early development of cortical functional and anatomical organization.


Figures

Fig. 1.
Fig. 1.
Synchronous neuronal activity in the visual cortex of neonatal awake behaving ferrets occurs as burst packets.a, Top trace, Time series graph was computed from a single 100 sec acquisition trial for a P27 animal. It shows periodic macrobursts of neuronal activity across the 16 channel electrode array. Spike discharge rate at each electrode is encoded in gray scale along a different horizontal row(electrode 1 is the topmost row, andelectrodes 2–16 are successive rows down). Bin width, 40 msec. Bottom trace, Spike activity in electrode 10 for the same recording trial. Note that the bursts in electrode 10 correspond in time to the macrobursts in the time series graph above. b, Close-up of a burst in electrode 10 reveals elemental burst components, which can either occur rhythmically (inset 1) or as a single microburst (inset 2). Microburst duration ranged from 50 to 150 msec. The vertical line segments above the traces indicate discriminated spikes.
Fig. 2.
Fig. 2.
Cross-correlation analysis reveals long-range spatial organization. a, Four time series graphs shown for a P22 animal. Bin width, 40 msec. b, Spike activity in electrodes 6–10 for the leftmost time series graph in a, from 20–70 sec, are shown. Although a macroburst was observed beginning at 33 sec, spikes were not precisely synchronized in time at all electrodes. Spike amplitudes typically vary from 50 to 150 μV. The vertical line segments above the traces represent discriminated spikes. c, Spatial pattern of correlated activity is stable at varying recording depths and can be observed in single trials. Cross-correlation maps obtained from the same P22 ferret are shown for eight different electrodes (electrodes 9–16). In each map, vertical bars plot the cross-correlation coefficient (r) computed between spikes recorded at the labeled electrode and all other electrodes (electrode 2 is the left bar, and electrodes 3–16 are successive barsto the right). Significant long-range secondary peaks are marked by asterisks (modified z test;p < 0.001). Top trace, Cross-correlation map for a single 43.3 min recording block (26 successive trials) at a recording depth of ∼250 μm. Note the secondary peaks in correlation maps for electrodes 9,10, 11, 15, and16. Middle trace, Cross-correlation map for another recording block in the same animal after electrodes were moved to a depth of 625 μm. The secondary peaks are at identical positions when compared with the top trace.Bottom trace, Cross-correlation map from a single 100 sec recording trial obtained from the recording block shown in thetop trace. Secondary peaks are present at identical positions. Bin width, 40 msec.
Fig. 3.
Fig. 3.
Long-range cortical organization is present in all animals. a, Cross-correlation maps for two adjacent electrodes are depicted for each animal. Left, Maps containing secondary peaks for four P22–P24 animals;right, examples for four P26–P28 animals.Asterisks indicate significant secondary peaks. Note that three animals show additional peaks that are spaced ∼2 mm apart.b, Summary graph of the distribution of average distances between correlation peaks among all eight animals. A total of six animals exhibit an average peak spacing of 1 mm.
Fig. 4.
Fig. 4.
Timing of spike activity underlies long-range correlations. Cross-correlation functions calculated between pairs of electrodes separated by different distances in a P22 ferret. Eachcolumn shows correlation functions computed between spikes recorded at electrode 10 and electrodes 11, 13, and 16 respectively. Thethree rows show correlation functions calculated during different 100 sec recording trials. 1, 2, and 3 denote the corresponding sites in the cross-correlation map on the right at which these functions were computed. Bin width, 20 msec.
Fig. 5.
Fig. 5.
Optic nerve transection alters temporal patterns of visual cortical spontaneous activity. a, Time series graphs of visual cortical activity obtained from a P22 ferret. The first set of three graphs shows control activity with intact LGN activity. The second set of graphs shows changes in the pattern of visual cortical bursts after optic nerve transection, which completely abolishes LGN activity for approximately the first 50 min but stabilizes to a new spatiotemporal pattern over the following 6 hr. The first, second, and third graphs were obtained 10 min, 6 hr, and 13 hr, respectively, after optic nerve transection. There is no significant change in the visual cortical bursting pattern over this time period.b, Time series graphs of visual cortical activity obtained from a P28 ferret. Time series graphs are shown before and after cessation of LGN activity as in a. In the second set of graphs, the first, second, and third graphs were obtained 15 min, 5 hr, and 15 hr, respectively, after transection of both optic nerves. c, Left, Average duration of macrobursts of younger (P22–P24) and older (P26–P28) animals before (white) and after (gray) transection of both optic nerves. At all ages, there was a significant decrease in macroburst duration, marked by asterisks. Error bars represent the SD from the mean. Right, Average frequency of macrobursts before and after optic nerve cut. Note that there is a significant increase in macroburst frequency only in P26–P28 animals.
Fig. 6.
Fig. 6.
Single and rhythmic microbursts persist despite the absence of LGN input activity. Spike trace of activity acquired from electrode 16 of a P26 animal for a single trial 11.7 min after transection of both optic nerves. Inset 1, Close-up of a burst in electrode 16 revealed microbursts that occur alone and rhythmically. The vertical line segments above or below the traces represent discriminated spikes.
Fig. 7.
Fig. 7.
Correlated patterns of activity in the visual cortex remain stable despite the absence of LGN input activity.a, Top trace, Control cross-correlation maps in a P22 ferret over a single recording block before transiently blocking LGN activity by transection of both optic nerves.Bottom trace, Cross-correlation maps obtained in the same animal and at the same recording depth. Recordings were made within the first 45 min of cutting both optic nerves during which LGN activity was abolished. These maps show the same pattern of long-range secondary peaks. In each map, electrode 2 is theleftmost vertical bar, and electrodes 3–16 are successive bars to theright. Reciprocal long-range secondary peaks, marked byasterisks, are present at the same locations before and after transiently blocking LGN activity by cutting the optic nerves. The horizontal dash line (r = 0.04) shows the statistical significance level for computed correlation coefficients (p < 0.05). b, Spatial correlation maps from a single P28 ferret for electrodes 1–15. Control maps are shown in the top trace, and test correlation maps obtained in the same animal after cutting both optic nerves are shown in the bottom trace. Recording procedure was the same as described ina.

References

    1. Caríc D, Price DJ. Evidence that the lateral geniculate nucleus regulates the normal development of visual corticocortical projections in the cat. Exp Neurol. 1999;156:353–362. - PubMed
    1. Chapman B, Stryker MP. Development of orientation selectivity in ferret visual cortex and effects of deprivation. J Neurosci. 1993;13:5252–5262. - PMC - PubMed
    1. Chapman B, Stryker MP, Bonhoeffer T. Development of orientation preference maps in ferret primary visual cortex. J Neurosci. 1996;16:6443–6453. - PMC - PubMed
    1. Crowley JC, Katz LC. Development of ocular dominance columns in the absence of retinal input. Nat Neuroscience. 1999;2:1125–1129. - PubMed
    1. Crowley JC, Katz LC. Early development of ocular dominance columns. Science. 2000;290:1321–1324. - PubMed

Publication types