. 2001 Nov 15;21(22):8990-9000.
doi: 10.1523/JNEUROSCI.21-22-08990.2001.

Combined effects of intrinsic facilitation and modulatory inhibition of identified interneurons in the siphon withdrawal circuitry of Aplysia

Affiliations

Combined effects of intrinsic facilitation and modulatory inhibition of identified interneurons in the siphon withdrawal circuitry of Aplysia

A S Bristol et al. J Neurosci. .

Abstract

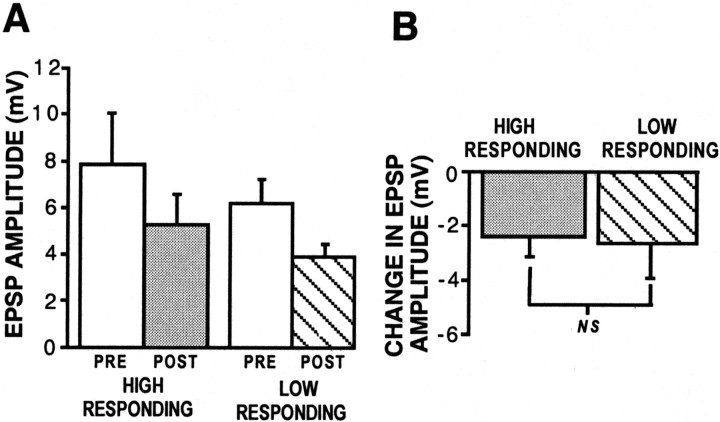
Synaptic plasticity can be induced through mechanisms intrinsic to a synapse or through extrinsic modulatory mechanisms. In this study, we investigated the relationship between these two forms of plasticity at the excitatory synapse between L29 interneurons and siphon motor neurons (MNs) in Aplysia. Using isolated ganglia, we confirmed that the L29-MN synapses exhibit a form of intrinsic facilitation: post-tetanic potentiation (PTP). We also found that L29-MN synapses are modulated by exogenous application of 5-HT: they are depressed after 5-HT exposure. We next investigated the functional relationship between an intrinsic facilitatory process (PTP) and extrinsic inhibitory modulation (5-HT-induced depression). First, we found that application of 5-HT just before L29 activation results in a reduction of PTP. Second, using semi-intact preparations, we found that tail shock (TS) mimics the effect of 5-HT by both depressing L29 synaptic transmission and by reducing L29 PTP. Third, we observed a significant correlation between L29 activity during TS and subsequent synaptic change: low-responding L29s showed synaptic depression after TS, whereas high-responding L29s showed synaptic facilitation. Finally, we found that we could directly manipulate the sign and magnitude of TS-induced synaptic plasticity by controlling L29 activity during TS. Collectively, our results show that the L29-MN synapses exhibit intrinsic facilitation and extrinsic modulation and that the sign and magnitude of L29-MN plasticity induced by TS is governed by the combined effects of these two processes. This circuit architecture, which combines network inhibition with cell-specific facilitation, can enhance the signal value of a specific stimulus within a neural network.


Figures

Fig. 1.
Fig. 1.
Post-tetanic potentiation (PTP) of the L29–MN synapse after intracellular activation. After measuring the baseline EPSP amplitude, L29 was activated intracellularly at 20 Hz for 5 sec.A, Simultaneous intracellular recordings from a siphon MN and an L29 interneuron. Tetanus symbol indicates L29 activation. B, Summary data from synapses both before and after tetanus (N = 35). Synaptic enhancement was greatest when measured 10 sec after activation.
Fig. 2.
Fig. 2.
5-HT transiently inhibits the L29–MN EPSP. After measuring the baseline EPSP amplitude, 5-HT (10 or 50 μm) was bath-applied for 2 min. A, Simultaneous intracellular recordings from a siphon MN and an L29 interneuron. The5-HT symbol indicates 5-HT application. 5-HT induced inhibition of the EPSP at the 30 sec test. At 5 min after 5-HT, the EPSP returned to near pre-5-HT levels (dashed lines).B, Summary data from synapses measured both pre-5-HT and post-5-HT (10 μm, N = 9, mean = 4.08 mV; 50 μm, N = 7, mean = 9.78 mV). In all cases, the magnitude of 5-HT-induced inhibition was greatest 30 sec after 5-HT.
Fig. 3.
Fig. 3.
5-HT reduces L29 and MN input resistance. L29 sec and MNs were injected with 1 nA of hyperpolarizing current before and after 5-HT application. Summary data from 12 experiments examining L29 input resistance (open circles; mean = 25.02 MΩ). The 5-HT-induced reduction in L29 input resistance was greatest 30 sec after 5-HT (10 μm). Summary data from six experiments examining MN input resistance (filled circles; mean = 18.13 MΩ). 5-HT exposure (50 μm) reduced MN input resistance through the 10 min test.
Fig. 4.
Fig. 4.
5-HT transiently reduces the effectiveness of L29 to activate the MN during tetanus. L29 sec were activated (20 Hz, 5 sec) before 50 μm 5-HT, 30 sec after 5-HT, and 10 min after 5-HT. For each tetanus, the area under the MN complex EPSP recorded during the 5 sec L29 activation was integrated (data expressed as millivolts per second). A, Intracellular recordings from a siphon MN during a single experiment. Shaded arearepresents period of L29 activation during which the complex EPSP was integrated. In most experiments, MN spiking did not occur during L29 tetanus (see Results). B, Summary data from 15 experiments. A significant difference was observed for MN complex EPSPs measured before and 30 sec after 5-HT. MN complex EPSPs measured 10 min after 5-HT did not differ from pre-5-HT values.
Fig. 5.
Fig. 5.
Recovery of L29 PTP from 5-HT-induced inhibition after 10 min washout. After a pretest of the EPSP, PTP was induced by activating L29 at 20 Hz for 5 sec. Post-tests of synaptic strength were taken at a 10 sec ITI for up to 1 min, with an additional test at 5 min. This constituted a PTP test (see Materials and Methods). 5-HT (50 μm) was perfused for 2 min. 5-HT exposure (50 μm) reduced PTP when the second tetanus was administered 30 sec after 5-HT (N = 7) but not when administered 10 min after 5-HT (N = 12).A1, Summary data of 30 SEC TEST.A2, Summary data shown inA1 expressed as percentage of change from pre-tetanus baseline EPSP. Analysis of percentage of change at 10 sec after tetanus revealed no difference between PTP tests. Note the reduced EPSP amplitude of the post-5-HT PRE value in the 30 sec test reflecting 5-HT-induced inhibition. B1, Summary data of 10 MIN TEST. B2, Summary data from B1 expressed as percentage of change from pre-tetanus baseline EPSP. Analysis of percentage of change at 10 sec revealed that PTP induced 10 min after 5-HT was no different from pre-5-HT PTP.
Fig. 6.
Fig. 6.
Tail shock (TS) inhibits the L29–MN EPSP. TS (45–60 mA, 1 sec) was administered to the dorsal tail. Synaptic strength was measured before, 5 min after, and 10 min after TS.A, Simultaneous intracellular recordings from an L29 and a siphon MN. Tail shock symbol indicates when TS was administered. B, Summary data comparing the effect of TS on L29–MN synaptic strength. TS produced inhibition of the EPSP with maximum effect at 10 min after TS (N = 19; mean baseline EPSP = 6.96 mV). Control preparations (N = 10; mean baseline EPSP = 4.87 mV) not receiving TS showed no change. Average L29 firing frequency during TS = 19.08 Hz, SEM ± 3.15.
Fig. 7.
Fig. 7.
TS-induced inhibition reduces L29 PTP. Comparison of PTP induced by intracellular activation (A) with PTP induced by TS activation (B). After a baseline EPSP measurement, PTP was induced by intracellular activation of an L29 at varying frequencies in different experiments for 1 sec and tested 10 sec after stimulation. Similarly, after a baseline EPSP measurement, a TS (45–60 mA, 1 sec) was applied to the dorsal surface of the tail, and the EPSP was tested 10 sec after shock (filled triangles;N = 21). In a subset of experiments (asterisks), L29s were only tetanized (N = 4) or activated by TS (N = 4). A, Scatterplot depicting percentage of change in EPSP amplitude as a function of L29 firing frequency when the L29 was activated intracellularly. B,Scatterplot depicting percentage of change in EPSP amplitude as a function of L29 firing frequency when the L29 was activated by TS. In each graph, line represents best-fit line. Shaded area indicates frequencies over which synaptic inhibition was observed after L29 activation by TS.
Fig. 8.
Fig. 8.
L29 activation during TS determines net synaptic change. After a baseline EPSP measurement, a TS was administered and an EPSP test was taken 10 sec after shock. The procedure was repeated 10 min later with the addition of an intracellular activation (20 Hz, 1 sec) or hyperpolarization (5–9 nA) of the L29 applied during the second TS. A, Recordings from a siphon MN and a low-responding L29 interneuron during TS. The response of the L29 during the TS event is shown in the inset.Top, After the first TS, the EPSP was reduced below baseline (dashed lines). Bottom, During the second TS, the L29 was activated intracellularly, as indicated in the inset. After the second TS, the EPSP was now increased above baseline. B, Recordings of a siphon MN and a high-responding L29 interneuron during TS. Top,After the first TS, the EPSP was elevated above baseline.Bottom, The response of the L29 was reduced although hyperpolarization during the second TS, as indicated in theinset. After the second TS, the EPSP was now decreased below baseline.
Fig. 9.
Fig. 9.
Summary data. A1, EPSP amplitude before and 10 sec after two separate TSs for low-responding L29s are shown (N = 8). During the second TS, the L29s were tetanized at 20 Hz. A2, EPSP amplitude before and 10 sec after two separate TSs for high-responding L29s are shown (N = 6). During the second TS, the L29s were hyperpolarized to reduce or prevent spiking.B, Quantitative comparison of experiments in which L29 responsiveness to TS was manipulated. Activation of unresponsive L29s during TS resulted in a net increase in L29–MN synaptic strength, whereas hyperpolarization of responsive L29s during TS resulted in a net decrease in synaptic strength.
Fig. 10.
Fig. 10.
TS exerts uniform inhibition on high-responding and low-responding L29s. The inhibitory effect of TS on high-responding and low-responding L29s was assessed at 10 min after TS, a time when PTP has returned to baseline. A, Summary data from 19 experiments showing a reduction in EPSP amplitude 10 min after TS for both high-responding (left) and low-responding (right) L29 synapses. B, A quantitative comparison of the change in EPSP amplitude in both conditions shows that there is no difference in the amount of inhibition, expressed as change in EPSP amplitude 10 min after TS, for high- and low-responding L29 synapses.
Fig. 11.
Fig. 11.
A model of dual modulation of L29 by activity and by 5-HT during TS. Intrinsic facilitation (PTP) and extrinsic modulation (5-HT-induced inhibition) serve to enhance and reduce the EPSP amplitude, respectively. The net effect on EPSP amplitude is a sum of these two opposing processes.Left, For HIGH ACTIVITY L29s, intrinsic facilitation offsets extrinsic inhibitory modulation, giving rise to net synaptic enhancement (shaded area).Right, For LOW ACTIVITY L29s, intrinsic facilitation is weak compared with extrinsic inhibitory modulation, with a net effect of no change or a reduction in synaptic strength (shaded area).

Similar articles

Cited by

References

    1. Armitage BA, Siegelbaum SA. Presynaptic induction and expression of homosynaptic depression at Aplysia sensorimotor neuron synapses. J Neurosci. 1998;18:8770–8779. - PMC - PubMed
    1. Barbeau H, Rossignol S. Initiation and modulation of the locomotor pattern in the adult chronic spinal cat by noradrenergic, serotonergic, and dopaminergic drugs. Brain Res. 1991;546:250–260. - PubMed
    1. Bear MF. Homosynaptic long-term depression: a mechanism for memory? Proc Natl Acad Sci USA. 1999;96:9457–9458. - PMC - PubMed
    1. Belkin KJ, Abrams TW. The effect of the neuropeptide FMRFamide on Aplysia californica siphon motoneurons involves multiple ionic currents that vary seasonally. J Exp Biol. 1998;201:2225–2234. - PubMed
    1. Bristol AS, Fischer TM, Carew TJ. Characterization and modulation of activity-dependent plasticity at the L29-MN synapse in Aplysia. Soc Neurosci Abstr. 1998;24:702.

Publication types

MeSH terms

LinkOut - more resources