. 2001 Nov 6;98(23):13072-7.
doi: 10.1073/pnas.231377398.

Cholesterol depletion induces large scale domain segregation in living cell membranes

Affiliations

Cholesterol depletion induces large scale domain segregation in living cell membranes

M Hao et al. Proc Natl Acad Sci U S A. .

Abstract

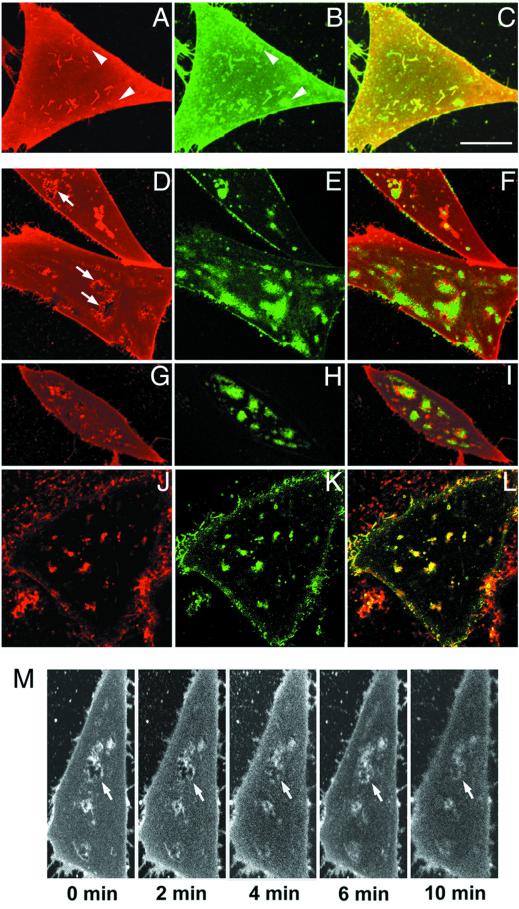
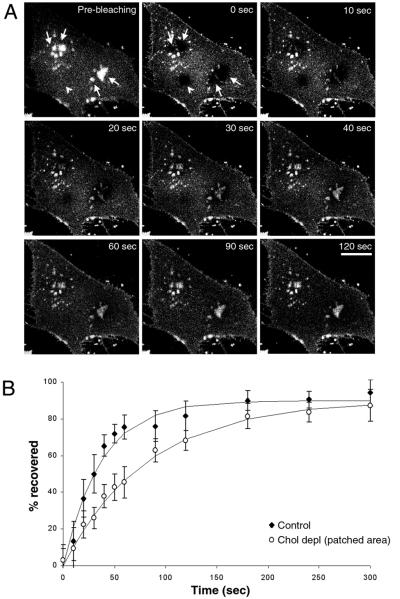
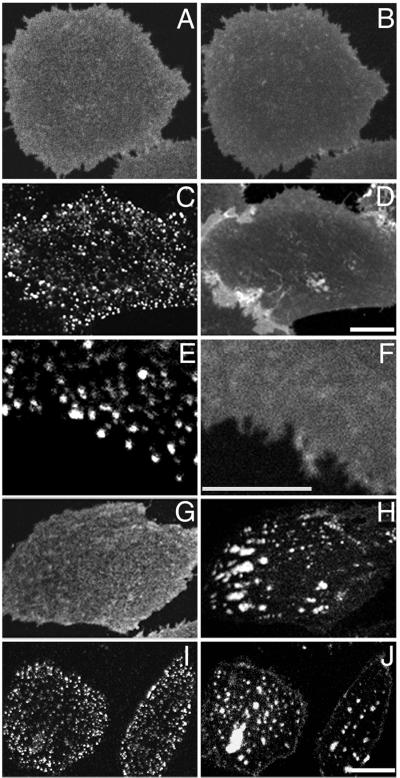
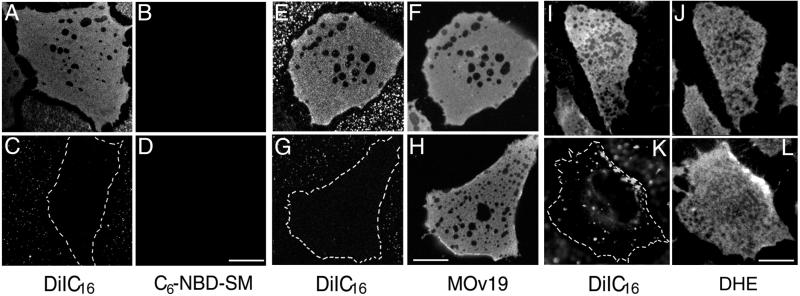
Local inhomogeneities in lipid composition play a crucial role in regulation of signal transduction and membrane traffic. Nevertheless, most evidence for microdomains in cells remains indirect, and the nature of membrane inhomogeneities has been difficult to characterize. We used lipid analogs and lipid-anchored proteins with varying fluidity preferences to examine the effect of modulating cellular cholesterol on domain formation. We show that lowering cholesterol levels induces formation of visible micrometer-scale domains in the plasma membrane of several mammalian cell types with complementary distributions of fluorescent lipid analogs with preferences for fluid or ordered domains. A uniform distribution is restored by cholesterol repletion. Unexpectedly, cholesterol depletion does not visibly alter the distribution of a crosslinked or uncrosslinked glycosylphosphatidylinositol-anchored protein (the folate receptor). We also examined the effect of varying cholesterol content on the cold Triton X-100 solubility of several membrane constituents. Although a cholesterol analog, dehydroergosterol, and a glycosylphosphatidylinositol-anchored protein are largely retained after extraction, a lipid analog with saturated 16-carbon acyl chains is largely removed when the cellular cholesterol level is lowered. This result indicates that after cholesterol depletion molecules in the more ordered domains can be extracted differentially by cold nonionic detergents.


Figures

Figure 1
Figure 1
Effect of cholesterol modulation on the distribution of lipid analogs in the plasma membranes of living CHO cells. The images presented are single confocal sections near the bottom adherent surfaces of living TRVb-1 cells. The lipid analogs used are: A, D, G, and M, DiIC16 (ordered domain-preferring); J, DiIC12 (fluid domain-preferring); B, E, H, and K, C6-NBD-SM (fluid domain-preferring); C, F, I, and L, red-green overlay. (A–C) Cells grown under normal tissue culture conditions and double-labeled with DiIC16 and C6-NBD-SM for 20 sec at 37°C. (D–L) Cells in which total cellular cholesterol levels have been depleted to 40% of control levels (estimated by cholesterol oxidase assay using total cell lipid extract) either by growing the cells for 3 days in metabolic depletion medium (D–F and J–L) or by treating them with the cholesterol-sequestering agent MβCD (G–I) before labeling. M demonstrates that the distribution pattern shown in D–I is a direct result of cholesterol depletion. Cholesterol-loaded MβCD (10 mM) was added to cholesterol-depleted cells prelabeled with DiIC16, and the cells were imaged over a period of 10 min (in 2-min intervals). Stacks of confocal planes were taken to avoid misrepresentation caused by a shift in focal planes (data not shown). (Bar, 10 μm.)
Figure 2
Figure 2
Fluorescence recovery after photobleaching in cholesterol-depleted cells. (A) Cholesterol-depleted cells are labeled with C6-NBD-SM, and an image is acquired before photobleaching (Pre-bleaching). Several regions of the membrane are photobleached simultaneously for a very brief period by a 25-mW argon laser emitting at 488 nm. Images are taken at different time points after photobleaching to monitor the fluorescence recovery. (Bar, 10 μm.) (B) After background correction, a ratio of fluorescence intensities in a photobleached region vs. the entire cell is calculated for each time point. This ratio is divided by the corresponding ratio obtained from the prebleaching image and presented as the percentage recovered in B. Each data point, derived from an average of 10 experiments, is fit to the equation y = y0 + a(1 − ekt) by sigmaplot scientific graphing software, where k is the rate constant.
Figure 3
Figure 3
Role of cholesterol modulation in the domain segregation of GPI-anchored proteins. CHO cells expressing the GPI-linked human folate receptor (FRαTb-1) are grown in either normal growth medium (A–F) or cholesterol depletion medium (G–J). Cells are double-labeled with Cy3-MOv19, a monoclonal antibody against the human folate receptor (A, C, G, and I), with Alexa 488-MOv19 (E), DiIC16 (F), and C6-NBD-SM (B, D, H, and J). Shown in this figure are the cell surface distributions of folate receptors uncrosslinked (A–B and G–H) and crosslinked by unlabeled polyclonal secondary antibodies (C–F and I–J). (Bar, 3 μm.)
Figure 4
Figure 4
Cold Triton extractability of DiIC16, C6-NBD-SM, folate receptor, and DHE in normal and cholesterol-modulated cells. TRVb-1 cells first are double-labeled with C6-NBD-SM and DiIC16 at 37°C for 20 sec, washed, and extracted with 1% TX-100 on ice for 30 min (A–D). Labeling on ice for 30 min gave the same extraction result (data not shown). For E–H, FRαTb-1 cells first are labeled with Alexa 488-MOv19 for 8 min and then labeled with DiIC16 for 20 sec at 37°C, washed, and extracted as described above. (I–L) Epifluorescence images. TRVb-1 cells first are labeled with DHE for 1 min, washed, and then labeled with DiIC16 for 20 sec at 37°C, and extracted as described. A, C, E, G, I, and K, DiIC16; B and D, C6-NBD-SM; F and H, Alexa 488-MOv19; J and L, DHE. In A–B, E–F, and I–J the cells are grown in normal growth medium; in C–D, G–H, and K–L the cells are treated with 10 mM MβCD for 30 min at 37°C before labeling. (Bar, 10 μm.)

References

    1. Brown D A, London E. J Biol Chem. 2000;275:17221–17224. - PubMed
    1. Simons K, Ikonen E. Nature (London) 1997;387:569–572. - PubMed
    1. Brown D A, Rose J K. Cell. 1992;68:533–544. - PubMed
    1. Brown D A, London E. J Membr Biol. 1998;164:103–114. - PubMed
    1. Roper K, Corbeil D, Huttner W B. Nat Cell Biol. 2000;2:582–592. - PubMed

Publication types