. 2001 Nov 6;98(23):13361-6.
doi: 10.1073/pnas.231487398.

Chromosomal variation in neurons of the developing and adult mammalian nervous system

Affiliations

Chromosomal variation in neurons of the developing and adult mammalian nervous system

S K Rehen et al. Proc Natl Acad Sci U S A. .

Abstract

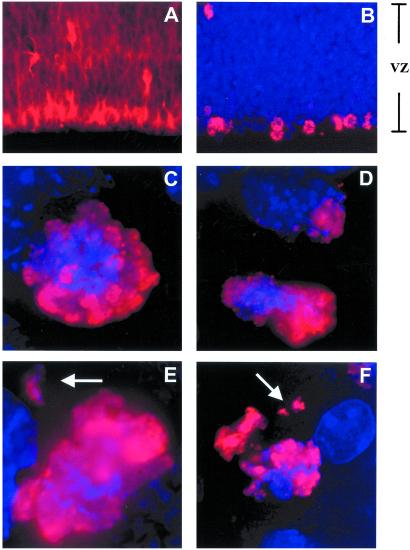
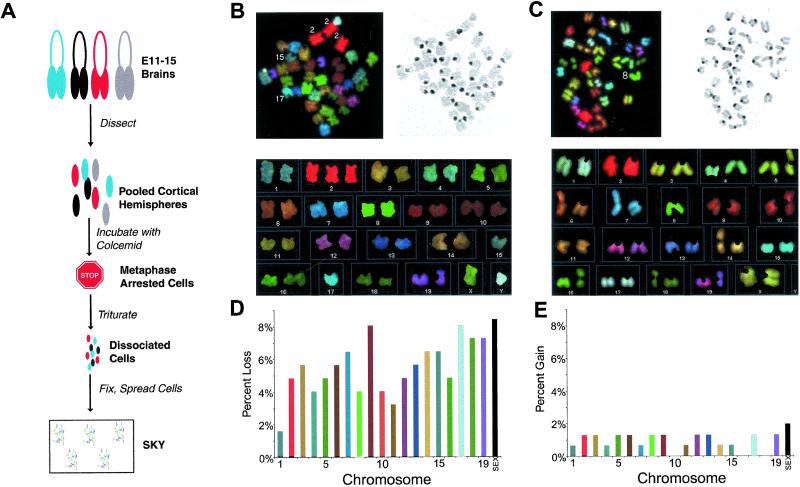
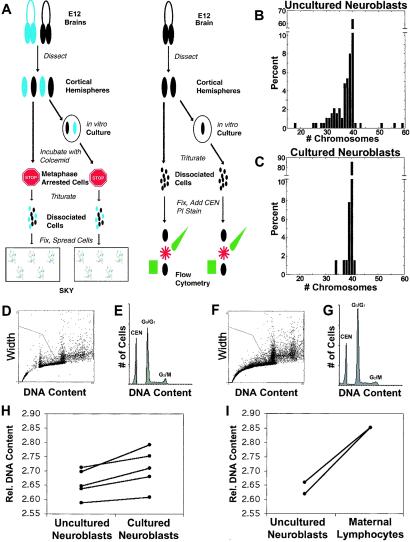
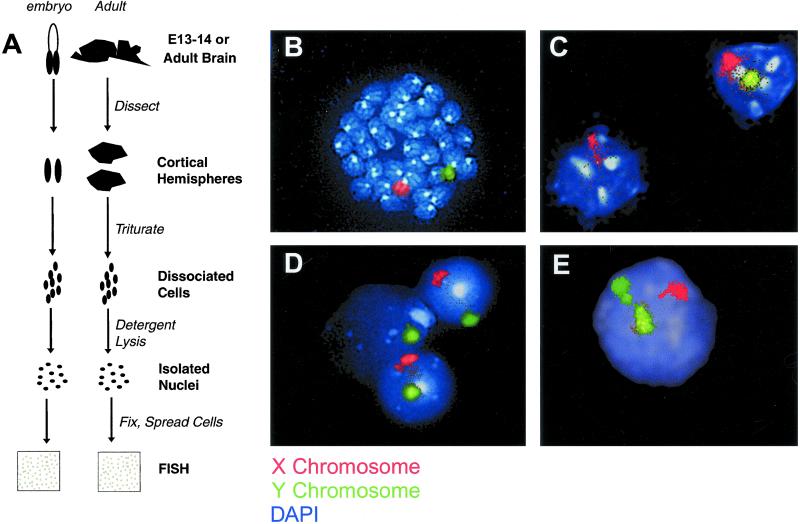
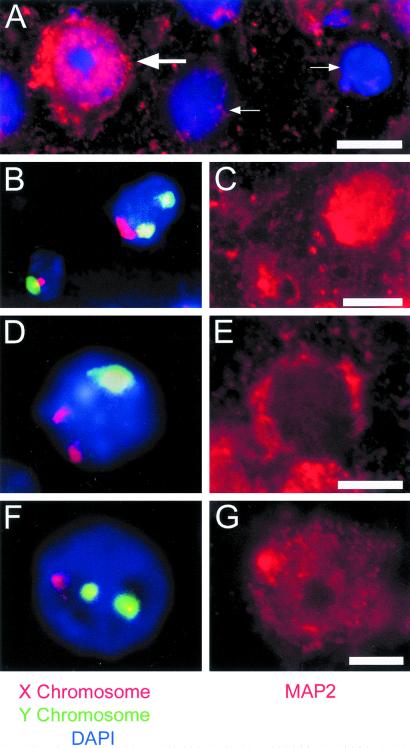
A basic assumption about the normal nervous system is that its neurons possess identical genomes. Here we present direct evidence for genomic variability, manifested as chromosomal aneuploidy, among developing and mature neurons. Analysis of mouse embryonic cerebral cortical neuroblasts in situ detected lagging chromosomes during mitosis, suggesting the normal generation of aneuploidy in these somatic cells. Spectral karyotype analysis identified approximately 33% of neuroblasts as aneuploid. Most cells lacked one chromosome, whereas others showed hyperploidy, monosomy, and/or trisomy. The prevalence of aneuploidy was reduced by culturing cortical explants in medium containing fibroblast growth factor 2. Interphase fluorescence in situ hybridization on embryonic cortical cells supported the rate of aneuploidy observed by spectral karyotyping and detected aneuploidy in adult neurons. Our results demonstrate that genomes of developing and adult neurons can be different at the level of whole chromosomes.


Figures

Figure 1
Figure 1
Mitotic neuroblasts in the embryonic mouse cortex with lagging chromosomes. (A and B) Low magnification (×20) micrographs of the embryonic cerebral cortex. Immunofluorescence for the intermediate filament protein nestin (A), a neural progenitor cell marker, illustrates the distribution of neuroblasts in the ventricular zone (VZ) of the embryonic cerebral cortex. Phospho-H3 labeling (B, red) reveals mitotic neuroblasts concentrated at the ventricular surface (bottom) of the VZ. Nuclei are counterstained with DAPI (blue). (CF) High magnification (×100) Z stacks from deconvolution microscopy of phospho-H3-labeled mitotic figures at the bottom of the VZ reveal morphologically normal prometaphase/metaphase (C) and anaphase (D) profiles. In addition, lagging chromosomes (arrows) are readily observed in prometaphase/metaphase (E) and anaphase (F) profiles.
Figure 2
Figure 2
Aneuploid neuroblasts in the embryonic mouse brain. (A) Flowchart summarizing the protocol for neuroblast SKY. Cortical hemispheres were pooled from embryonic littermates to ensure abundant prometaphase/metaphase spreads. (B and C) SKYs from representative aneuploid prometaphase/metaphase embryonic neuroblasts. (Top Left and Right) Spectral and inverse DAPI images of chromosome spreads are shown, respectively. (Bottom) The karyotypes are shown. Note that each different chromosome has a unique spectral color. Euploid chromosome number in mice is 40. The prometaphase/metaphase spread in B has an extra copy of chromosome 2, but has only 1 copy of chromosomes 15 and 17 (39, XY, +2, −15, −17). The prometaphase/metaphase spread in C has only 1 copy of chromosome 8 (39, XX, −8). Observed loss and gain of whole chromosomes appeared to be similar between males and females. (D and E) Graphs show the percentage of loss (D) and gain (E) of specific chromosomes in neuroblasts. Bars are color-coded based on the spectral color of each chromosome (except for sex chromosomes). Specific chromosomes are lost at rates of 1.6–8.4% of cells analyzed and are gained at rates of less than 2%.
Figure 3
Figure 3
The rate of aneuploidy is attenuated in vitro. (A) Flowchart summarizing the protocol for comparison of uncultured (acutely isolated) and cultured neuroblasts by SKY and flow cytometry. (B and C) Chromosome count histograms from SKY analysis of uncultured (B) and cultured with FGF-2 (C) neuroblasts reveal a decrease in the proportion of aneuploid cells in cultured preparations. The fraction of cells missing more than one chromosome was lower in cultured than in uncultured neuroblasts. In both conditions, the majority of prometaphases/metaphases examined had 40 chromosomes; among aneuploid cells, the majority had lost chromosomes. The mean number of chromosomes is 38.69 for uncultured neuroblasts and 39.77 for cultured neuroblasts, a difference of 2.78%. (DG) Flow cytometric analysis of propidium iodide-stained neuroblasts from uncultured (D and E) and cultured (F and G) cortical hemispheres. DNA content histograms for uncultured (E) and cultured (G) neuroblasts are qualitatively similar. For quantitation of DNA content, Gaussians were fit to the G0/G1 and chick erythrocyte nuclei (CEN) peaks. Relative DNA content was expressed as the ratio of the mean of the G0/G1 peak to the mean of the CEN peak. (H) Cultured neuroblasts have 2% more genomic DNA on average than uncultured neuroblasts (P < 0.01, paired t test). Each solid line connects uncultured to cultured samples from the same animal. Error bars are omitted for visual clarity but were never greater than 0.55%. (I) Maternal lymphocytes have more genomic DNA than uncultured neuroblasts.
Figure 4
Figure 4
Aneuploid cells in the adult mouse brain. (A) Flowchart summarizing the protocol for XY FISH on isolated nuclei from embryonic and adult cerebral cortices. (B) A male lymphocyte prometaphase/metaphase spread hybridized with X (red) and Y (green) chromosome paints illustrates the specificity of these reagents. (CE) Isolated interphase nuclei from adult male cortices were hybridized with X (red) and Y (green) chromosome paints. Nuclei were counterstained with DAPI (blue/white). Euploid male nuclei showed exactly one painted X chromosome (red) and one painted Y chromosome (green). (C) The nucleus on the right contains both an X and a Y chromosome, whereas the nucleus on the left is missing Y. (D) The nucleus in the middle is missing X, whereas the two nuclei flanking it are euploid. (E) This nucleus contains an extra Y chromosome.
Figure 5
Figure 5
Aneuploid cells in the adult cortex are neurons. (A) The presence of both MAP2-positive (large arrow) and MAP2-negative (small arrows) cells in a 10 μm section through adult cerebral cortex demonstrates the specificity of MAP2 labeling (red). Nuclei were counterstained with DAPI (blue). (BG) Cells in 10 μm sections through the adult male cortex were hybridized with X (red) and Y (green) chromosome paints (B, D, and F). Cells in these same 10 μm sections were then immunostained for MAP2 (C, E, and G). (B and C) The cell on the left contains both an X and a Y chromosome, whereas the cell on the right has an extra Y chromosome (B). The cell with 2 Y chromosomes is MAP2-positive (C). These cells are in visual cortex. (D and E) A cell in motor cortex contains an extra X chromosome (D) and is MAP2-positive (E). (F and G) A cell in motor cortex contains an extra Y chromosome (F) and is MAP2-positive (G). [Bars = 10 μm (A and C) and 5 μm (E and G).]

References

    1. Marin O, Anderson S A, Rubenstein J L. J Neurosci. 2000;20:6063–6076. - PMC - PubMed
    1. Schmucker D, Clemens J C, Shu H, Worby C A, Xiao J, Muda M, Dixon J E, Zipursky S L. Cell. 2000;101:671–684. - PubMed
    1. Wu Q, Maniatis T. Cell. 1999;97:779–790. - PubMed
    1. Yagi T, Takeichi M. Genes Dev. 2000;14:1169–1180. - PubMed
    1. Chun J, Schatz D G. Neuron. 1999;22:7–10. - PubMed

Publication types