

Speech comprehension is correlated with temporal response patterns recorded from auditory cortex
- PMID: 11698688
- PMCID: PMC60877
- DOI: 10.1073/pnas.201400998
Speech comprehension is correlated with temporal response patterns recorded from auditory cortex
Abstract
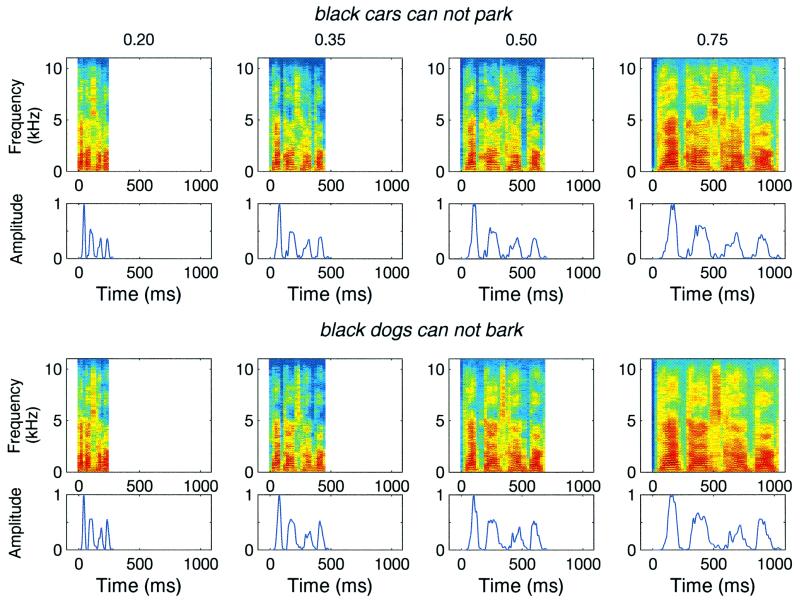
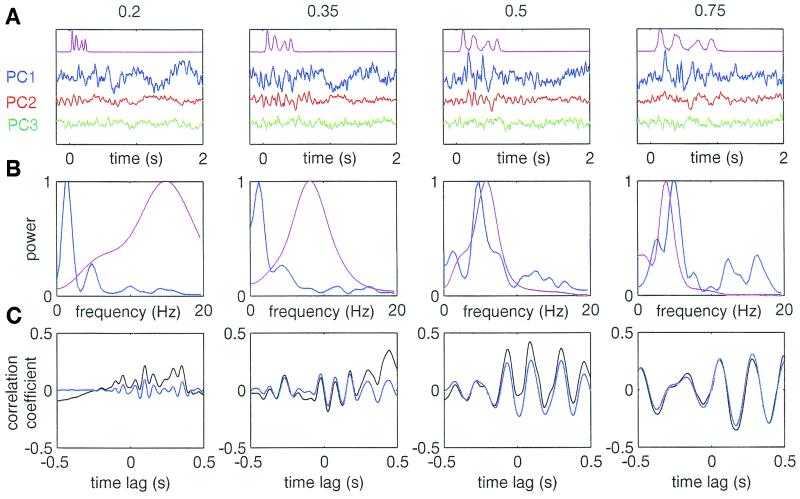
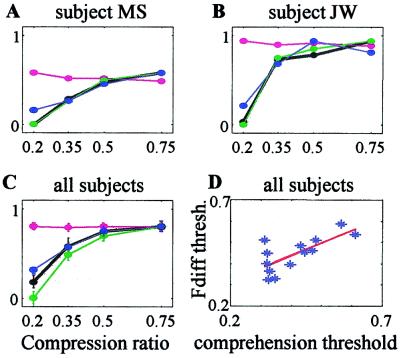
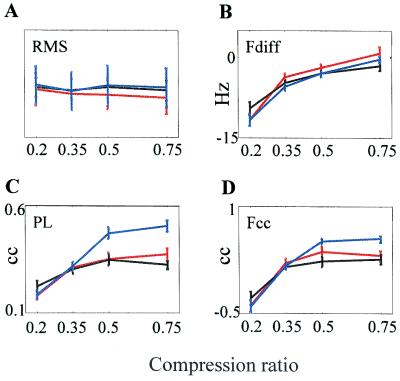
Speech comprehension depends on the integrity of both the spectral content and temporal envelope of the speech signal. Although neural processing underlying spectral analysis has been intensively studied, less is known about the processing of temporal information. Most of speech information conveyed by the temporal envelope is confined to frequencies below 16 Hz, frequencies that roughly match spontaneous and evoked modulation rates of primary auditory cortex neurons. To test the importance of cortical modulation rates for speech processing, we manipulated the frequency of the temporal envelope of speech sentences and tested the effect on both speech comprehension and cortical activity. Magnetoencephalographic signals from the auditory cortices of human subjects were recorded while they were performing a speech comprehension task. The test sentences used in this task were compressed in time. Speech comprehension was degraded when sentence stimuli were presented in more rapid (more compressed) forms. We found that the average comprehension level, at each compression, correlated with (i) the similarity between the frequencies of the temporal envelopes of the stimulus and the subject's cortical activity ("stimulus-cortex frequency-matching") and (ii) the phase-locking (PL) between the two temporal envelopes ("stimulus-cortex PL"). Of these two correlates, PL was significantly more indicative for single-trial success. Our results suggest that the match between the speech rate and the a priori modulation capacities of the auditory cortex is a prerequisite for comprehension. However, this is not sufficient: stimulus-cortex PL should be achieved during actual sentence presentation.
Figures
References
-
- Rosen S. Philos Trans R Soc London B Biol Sci. 1992;336:367–373. - PubMed
-
- Houtgast T, Steeneken H J M. J Acoust Soc Am. 1985;77:1069–1077.
-
- Drullman R, Festen J M, Plomp R. J Acoust Soc Am. 1994;95:1053–1064. - PubMed
-
- van der Horst R, Leeuw A R, Dreschler W A. J Acoust Soc Am. 1999;105:1801–1809. - PubMed
-
- Shannon R V, Zeng F G, Kamath V, Wygonski J, Ekelid M. Science. 1995;270:303–304. - PubMed
Publication types
MeSH terms
LinkOut - more resources
Full Text Sources
Other Literature Sources
Medical
