Characterization of two Bunodosoma granulifera toxins active on cardiac sodium channels
- PMID: 11704639
- PMCID: PMC1573052
- DOI: 10.1038/sj.bjp.0704361
Characterization of two Bunodosoma granulifera toxins active on cardiac sodium channels
Abstract
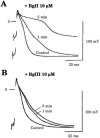
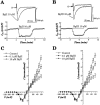
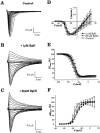
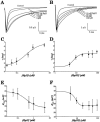
1. Two sodium channel toxins, BgII and BgIII, have been isolated and purified from the sea anemone Bunodosoma granulifera. Combining different techniques, we have investigated the electrophysiological properties of these toxins. 2. We examined the effect of BgII and BgIII on rat ventricular strips. These toxins prolong action potentials with EC50 values of 60 and 660 nM and modify the resting potentials. 3. The effect on Na+ currents in rat cardiomyocytes was studied using the patch-clamp technique. BgII and BgIII slow the rapid inactivation process and increase the current density with EC50 values of 58 and 78 nM, respectively. 4. On the cloned hH1 cardiac Na+ channel expressed in Xenopus laevis oocytes, BgII and BgIII slow the inactivation process of Na+ currents (respective EC50 values of 0.38 and 7.8 microM), shift the steady-state activation and inactivation parameters to more positive potentials and the reversal potential to more negative potentials. 5. The amino acid sequences of these toxins are almost identical except for an asparagine at position 16 in BgII which is replaced by an aspartic acid in BgIII. In all experiments, BgII was more potent than BgIII suggesting that this conservative residue is important for the toxicity of sea anemone toxins. 6. We conclude that BgII and BgIII, generally known as neurotoxins, are also cardiotoxic and combine the classical effects of sea anemone Na+ channels toxins (slowing of inactivation kinetics, shift of steady-state activation and inactivation parameters) with a striking decrease on the ionic selectivity of Na+ channels.
Figures


Similar articles
-
The sea anemone Bunodosoma granulifera contains surprisingly efficacious and potent insect-selective toxins.FEBS Lett. 2002 Dec 4;532(1-2):131-4. doi: 10.1016/s0014-5793(02)03653-0. FEBS Lett. 2002. PMID: 12459477
-
The sea anemone toxins BgII and BgIII prolong the inactivation time course of the tetrodotoxin-sensitive sodium current in rat dorsal root ganglion neurons.J Pharmacol Exp Ther. 2002 Dec;303(3):1067-74. doi: 10.1124/jpet.102.038570. J Pharmacol Exp Ther. 2002. PMID: 12438529
-
A new toxin from the sea anemone Condylactis gigantea with effect on sodium channel inactivation.Toxicon. 2006 Aug;48(2):211-20. doi: 10.1016/j.toxicon.2006.05.001. Epub 2006 May 19. Toxicon. 2006. PMID: 16814340
-
Actions of sea anemone type 1 neurotoxins on voltage-gated sodium channel isoforms.Toxicon. 2009 Dec 15;54(8):1102-11. doi: 10.1016/j.toxicon.2009.04.018. Epub 2009 Apr 23. Toxicon. 2009. PMID: 19393679 Review.
-
Site-3 sea anemone toxins: molecular probes of gating mechanisms in voltage-dependent sodium channels.Toxicon. 2007 Feb;49(2):159-70. doi: 10.1016/j.toxicon.2006.09.020. Epub 2006 Sep 28. Toxicon. 2007. PMID: 17095031 Review.
Cited by
-
The citrus flavanone hesperetin preferentially inhibits slow-inactivating currents of a long QT syndrome type 3 syndrome Na+ channel mutation.Br J Pharmacol. 2019 Apr;176(8):1090-1105. doi: 10.1111/bph.14577. Epub 2019 Mar 27. Br J Pharmacol. 2019. PMID: 30650182 Free PMC article.
-
Neurotoxins and pore forming toxins in sea anemones: Potential candidates for new drug development.Histol Histopathol. 2023 Jan;38(1):9-28. doi: 10.14670/HH-18-500. Epub 2022 Jul 26. Histol Histopathol. 2023. PMID: 35880756 Review.
-
Exploiting the nephrotoxic effects of venom from the sea anemone, Phyllodiscus semoni, to create a hemolytic uremic syndrome model in the rat.Mar Drugs. 2012 Jul;10(7):1582-1604. doi: 10.3390/md10071582. Epub 2012 Jul 23. Mar Drugs. 2012. PMID: 22851928 Free PMC article. Review.
-
CgNa, a type I toxin from the giant Caribbean sea anemone Condylactis gigantea shows structural similarities to both type I and II toxins, as well as distinctive structural and functional properties(1).Biochem J. 2007 Aug 15;406(1):67-76. doi: 10.1042/BJ20070130. Biochem J. 2007. PMID: 17506725 Free PMC article.
-
The Sea Anemone Neurotoxins Modulating Sodium Channels: An Insight at Structure and Functional Activity after Four Decades of Investigation.Toxins (Basel). 2022 Dec 21;15(1):8. doi: 10.3390/toxins15010008. Toxins (Basel). 2022. PMID: 36668828 Free PMC article. Review.
References
-
- ALVAREZ J., DORTICO S.F., MORLANS J. Changes in electrical and mechanical activities of rabbit papillary muscle during hypoxic perfusion. J. Physiol. (Paris) 1981;77:807–812. - PubMed
-
- ANEIROS A., GARCIA I., MARTINEZ J.R., HARVEY A.L., ANDERSON A.J., MARSHALL D.L., ENGSTROM A., HELLMAN U., KARLSSON E. A potassium channel toxin from the secretion of the sea anemone Bunodosoma granulifera. Isolation, amino acid sequence and biological activity. Biochim. Biophys. Acta. 1993;1157:86–92. - PubMed
-
- BALSER J.R. Structure and function of the cardiac sodium channels. Cardiovasc. Res. 1999;42:327–338. - PubMed
Publication types
MeSH terms
Substances
LinkOut - more resources
Full Text Sources

