

Streptococcus pneumoniae PstS production is phosphate responsive and enhanced during growth in the murine peritoneal cavity
- PMID: 11705934
- PMCID: PMC98848
- DOI: 10.1128/IAI.69.12.7565-7571.2001
Streptococcus pneumoniae PstS production is phosphate responsive and enhanced during growth in the murine peritoneal cavity
Abstract
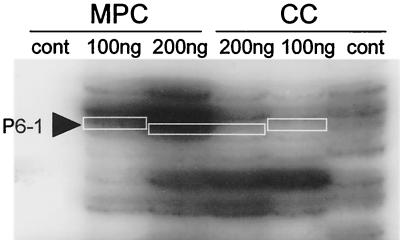
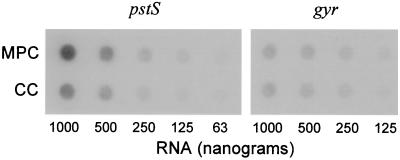
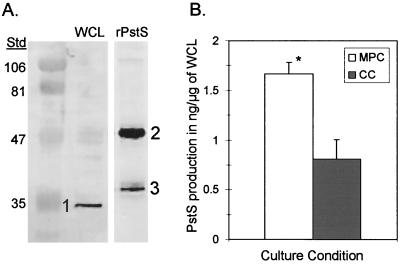
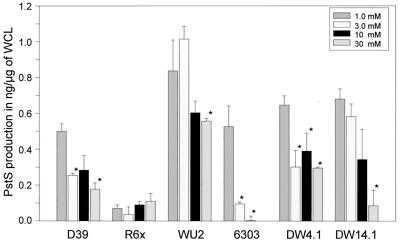
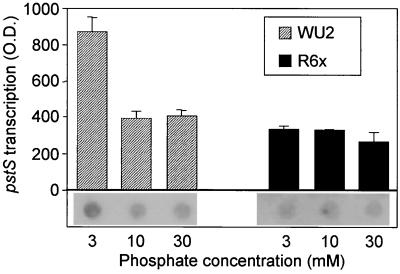
Differential display-PCR (DDPCR) was used to identify a Streptococcus pneumoniae gene with enhanced transcription during growth in the murine peritoneal cavity. Northern dot blot analysis and comparative densitometry confirmed a 1.8-fold increase in expression of the encoded sequence following murine peritoneal culture (MPC) versus laboratory culture or control culture (CC). Sequencing and basic local alignment search tool analysis identified the DDPCR fragment as pstS, the phosphate-binding protein of a high-affinity phosphate uptake system. PCR amplification of the complete pstS gene followed by restriction analysis and sequencing suggests a high level of conservation between strains and serotypes. Quantitative immunodot blotting using antiserum to recombinant PstS (rPstS) demonstrated an approximately twofold increase in PstS production during MPC from that during CCs, a finding consistent with the low levels of phosphate observed in the peritoneum. Moreover, immunodot blot and Northern analysis demonstrated phosphate-dependent production of PstS in six of seven strains examined. These results identify pstS expression as responsive to the MPC environment and extracellular phosphate concentrations. Presently, it remains unclear if phosphate concentrations in vivo contribute to the regulation of pstS. Finally, polyclonal antiserum to rPstS did not inhibit growth of the pneumococcus in vitro, suggesting that antibodies do not block phosphate uptake; moreover, vaccination of mice with rPstS did not protect against intraperitoneal challenge as assessed by the 50% lethal dose.
Figures
Similar articles
-
Immunogenicity and protective efficacy of tuberculosis DNA vaccines encoding putative phosphate transport receptors.J Immunol. 1999 Jan 15;162(2):1113-9. J Immunol. 1999. PMID: 9916741
-
Peritoneal culture alters Streptococcus pneumoniae protein profiles and virulence properties.Infect Immun. 2000 Oct;68(10):6082-6. doi: 10.1128/IAI.68.10.6082-6086.2000. Infect Immun. 2000. PMID: 10992528 Free PMC article.
-
Transcriptional and post-transcriptional regulation of pst2 operon expression in Vibrio cholerae O1.Infect Genet Evol. 2017 Jul;51:10-16. doi: 10.1016/j.meegid.2017.02.017. Epub 2017 Feb 27. Infect Genet Evol. 2017. PMID: 28242357
-
Activation by gene amplification of pitB, encoding a third phosphate transporter of Escherichia coli K-12.J Bacteriol. 2001 Aug;183(15):4659-63. doi: 10.1128/JB.183.15.4659-4663.2001. J Bacteriol. 2001. PMID: 11443103 Free PMC article.
-
Phosphate-binding proteins and peptides: from molecular mechanisms to potential applications.Curr Opin Biotechnol. 2024 Dec;90:103199. doi: 10.1016/j.copbio.2024.103199. Epub 2024 Sep 13. Curr Opin Biotechnol. 2024. PMID: 39276616 Review.
Cited by
-
Phosphate-containing polyethylene glycol polymers prevent lethal sepsis by multidrug-resistant pathogens.Antimicrob Agents Chemother. 2014;58(2):966-77. doi: 10.1128/AAC.02183-13. Epub 2013 Nov 25. Antimicrob Agents Chemother. 2014. PMID: 24277029 Free PMC article.
-
Unveiling the role of the PhoP master regulator in arsenite resistance through ackA downregulation in Lacticaseibacillus paracasei.Curr Res Microb Sci. 2025 Feb 5;8:100357. doi: 10.1016/j.crmicr.2025.100357. eCollection 2025. Curr Res Microb Sci. 2025. PMID: 40027449 Free PMC article.
-
Essential role of proline synthesis and the one-carbon metabolism pathways for systemic virulence of Streptococcus pneumoniae.mBio. 2024 Nov 13;15(11):e0175824. doi: 10.1128/mbio.01758-24. Epub 2024 Oct 18. mBio. 2024. PMID: 39422467 Free PMC article.
-
Effects of deletion of the Streptococcus pneumoniae lipoprotein diacylglyceryl transferase gene lgt on ABC transporter function and on growth in vivo.PLoS One. 2012;7(7):e41393. doi: 10.1371/journal.pone.0041393. Epub 2012 Jul 24. PLoS One. 2012. PMID: 22911788 Free PMC article.
-
Bacterial surface lipoproteins mediate epithelial microinvasion by Streptococcus pneumoniae.Infect Immun. 2024 May 7;92(5):e0044723. doi: 10.1128/iai.00447-23. Epub 2024 Apr 17. Infect Immun. 2024. PMID: 38629841 Free PMC article.
References
-
- Altschul S F, Gish W, Miller W, Myers E W, Lipman D J. Basic local alignment search tool. J Mol Biol. 1990;215:403–410. - PubMed
-
- Ames G F. Bacterial periplasmic transport systems: structure, mechanism, and evolution. Annu Rev Biochem. 1986;55:397–425. - PubMed
-
- Ausubel F M, Brent R, Kingston R E, Moore D D, Seidman J G, Smith J A, Struhl K, editors. Current protocols in molecular biology. New York, N.Y: John Wiley & Sons, Inc.; 1999.
-
- Birkey S M, Liu W, Zhang X, Duggan M F, Hulett F M. Pho signal transduction network reveals direct transcriptional regulation of one two-component system by another two-component regulator: Bacillus subtilis PhoP directly regulates production of ResD. Mol Microbiol. 1998;30:943–953. - PubMed
Publication types
MeSH terms
Substances
LinkOut - more resources
Full Text Sources
Molecular Biology Databases
