. 2001 Nov;127(3):1077-88.

A gene controlling variation in Arabidopsis glucosinolate composition is part of the methionine chain elongation pathway

Affiliations

A gene controlling variation in Arabidopsis glucosinolate composition is part of the methionine chain elongation pathway

J Kroymann et al. Plant Physiol. 2001 Nov.

Abstract

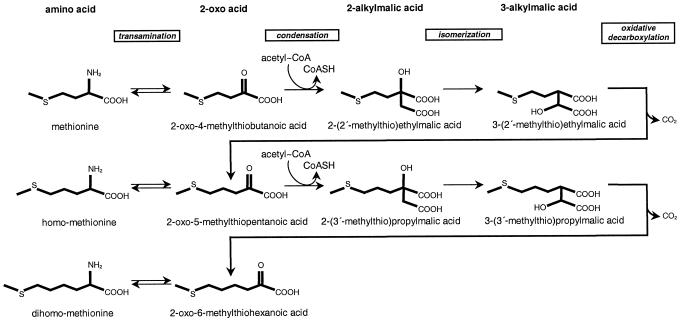
Arabidopsis and other Brassicaceae produce an enormous diversity of aliphatic glucosinolates, a group of methionine (Met)-derived plant secondary compounds containing a beta-thio-glucose moiety, a sulfonated oxime, and a variable side chain. We fine-scale mapped GSL-ELONG, a locus controlling variation in the side-chain length of aliphatic glucosinolates. Within this locus, a polymorphic gene was identified that determines whether Met is extended predominantly by either one or by two methylene groups to produce aliphatic glucosinolates with either three- or four-carbon side chains. Two allelic mutants deficient in four-carbon side-chain glucosinolates were shown to contain independent missense mutations within this gene. In cell-free enzyme assays, a heterologously expressed cDNA from this locus was capable of condensing 2-oxo-4-methylthiobutanoic acid with acetyl-coenzyme A, the initial reaction in Met chain elongation. The gene methylthioalkylmalate synthase1 (MAM1) is a member of a gene family sharing approximately 60% amino acid sequence similarity with 2-isopropylmalate synthase, an enzyme of leucine biosynthesis that condenses 2-oxo-3-methylbutanoate with acetyl-coenzyme A.


Figures

Figure 1
Figure 1
Postulated Met chain elongation pathway in glucosinolate biosynthesis. Shown are reaction steps and chemical structures for the first two rounds of chain elongation. The 2-oxo acid products are substrates for either transamination or subsequent condensation reactions.
Figure 2
Figure 2
Fine-scale mapping of GSL-ELONG. The DNA sequence of the GSL-ELONG region of chromosome V (outlined bar) was derived from the nonoverlapping sequences of K8E10, MRN17, T20O7, MYJ24, and MKD15 (GenBank accession nos. AB025618, AB005243, AB026660, AB006708, and AB007648). Vertical solid arrows labeled recMS1, rec6, recMS7, and recMS9 indicate the primer pair markers used for mapping the GSL-ELONG phenotype. The approximate sizes of intervals between these markers (horizontal arrows) are based on the Col-0 ecotype. Below, the region encompassing the MAM1 and MAM-L genes (thick horizontal arrows) is enlarged. Their approximate sizes and the size of the interval separating them are shown underneath. Additional primers and markers used to identify recombination points are indicated by vertical black arrows labeled Southex, 16Cm2, EDIT1-2a, 11t1, and EN-MS. The dashed vertical arrow indicates the recombination point which distinguishes functional effects of the MAM1 and MAM-L genes in family 5 (Table II).
Figure 3
Figure 3
Exon-intron structure of IPMS-like genes in Arabidopsis. Shown are exons (thick bars) and introns (thin bars) from start to stop of the ORF. Vertical thin lines connect homologous exons. Arrows indicate deviations from the predicted exon-intron structure of F15H18.3, as detected in the respective cDNAs.
Figure 4
Figure 4
HPLC chromatograms of glucosinolate profiles from Col-0 × CL5 F3 recombinant plants. Glucosinolates were extracted and separated as described in “Materials and Methods,” and identified by their retention times and UV spectra. Shown are signals from 3.5- to 10-min retention time during which time all of the glucosinolates eluted that varied in these crosses. Amounts are given in relative absorption units. The allelic state at MAM1 and MAM-L is indicated in the upper left corners. Specific glucosinolates are identified by numbers that correspond to Table III.
Figure 5
Figure 5
Missense mutations in MAM1 from mutant lines TU1 and TU5. The ORF of MAM1 is presented as a bar. Vertical lines within this bar show exon-exon borders. Nucleotide substitutions causing missense mutations are shown above the bar. Numbering refers to the nucleotide sequence.
Figure 6
Figure 6
Cell-free enzyme assay of E. coli expressing the MAM1 cDNA from Col-0. Cells were grown, extracted, and assayed with acetyl-CoA as described in “Materials and Methods.” Pictured are radioactivity detector traces of the HPLC separations of assay products from 30 to 45 min. The upper trace represents the complete assay, including [1-14C]acetyl-CoA and OMTB, and shows the production of MTEM (36.5 min), indicated by an arrow, and acetic acid (41 min), resulting from the hydrolysis of acetyl-CoA. The middle trace represents an assay without the cosubstrate OMTB, and the lower trace represents an assay with heat-denatured enzyme.

References

    1. Blau PA, Feeny P, Contardo L. Allylglucosinolate and herbivorous caterpillars: a contrast in toxicity and tolerance. Science. 1978;200:1296–1298. - PubMed
    1. Bodnaryk RP. Developmental profile of sinalbin (p-hydroxybenzyl glucosinolate) in mustard seedlings, Sinapis albaL., and its relationship to insect resistance. J Chem Ecol. 1991;17:1543–1556. - PubMed
    1. Bones AM, Rossiter JT. The myrosinase-glucosinolate system, its organization and biochemistry. Physiol Plant. 1996;97:194–208.
    1. Bradshaw JE, Heaney RK, Smith WHM, Gowers S, Gemmell DJ, Fenwick GR. The glucosinolate content of some fodder brassicas. J Sci Food Agric. 1984;35:977–981.
    1. Brown PD, Morra MJ. Glucosinolate-containing plant tissues as bioherbicides. J Agric Food Chem. 1995;43:3070–3074.

Publication types