. 2001 Nov;127(3):1167-79.

Inhibition of plastocyanin to P(700)(+) electron transfer in Chlamydomonas reinhardtii by hyperosmotic stress

Affiliations

Inhibition of plastocyanin to P(700)(+) electron transfer in Chlamydomonas reinhardtii by hyperosmotic stress

J A Cruz et al. Plant Physiol. 2001 Nov.

Abstract

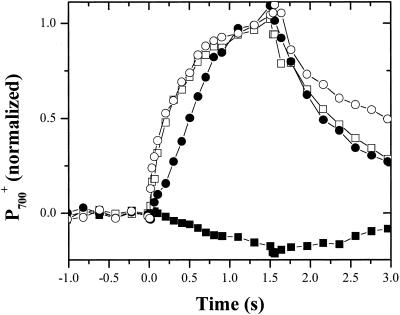
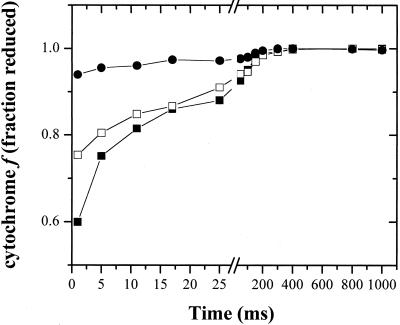
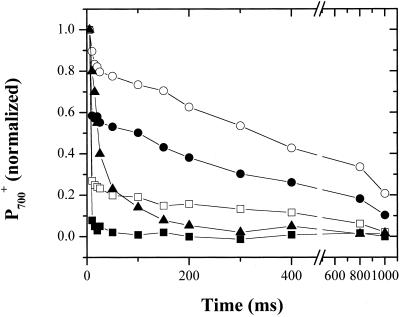
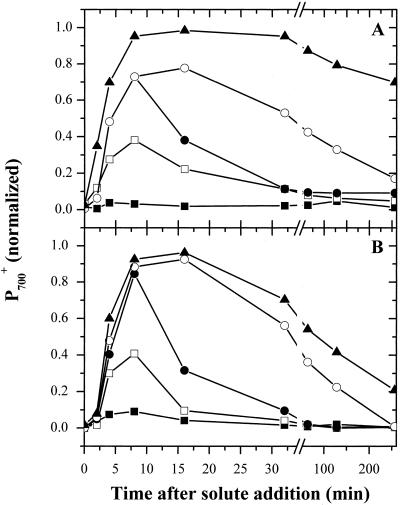
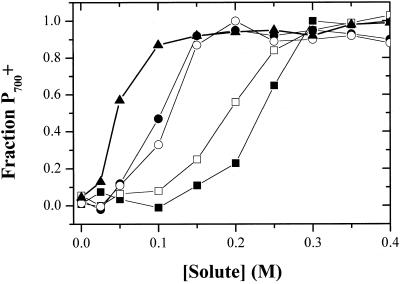
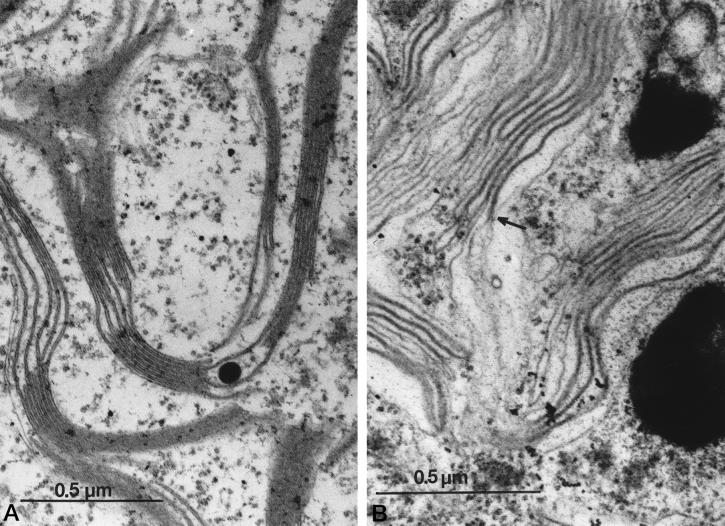
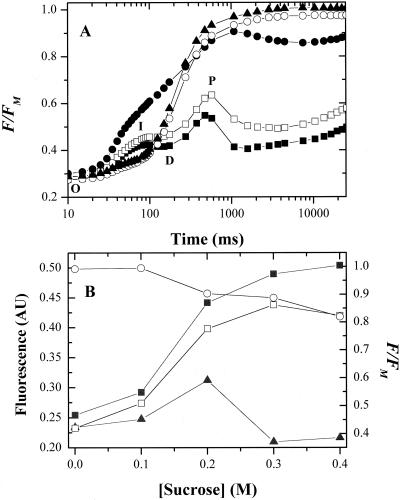
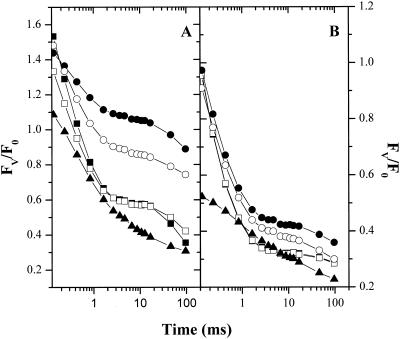
Oxygen electrode and fluorescence studies demonstrate that linear electron transport in the freshwater alga Chlamydomonas reinhardtii can be completely abolished by abrupt hyperosmotic shock. We show that the most likely primary site of inhibition of electron transfer by hyperosmotic shock is a blockage of electron transfer between plastocyanin (PC) or cytochrome c(6) and P(700). The effects on this reaction were reversible upon dilution of the osmolytes and the stability of plastocyanin or photosystem (PS) I was unaffected. Electron micrographs of osmotically shocked cells showed a significant decrease in the thylakoid lumen volume. Comparison of estimated lumenal width with the x-ray structures of plastocyanin and PS I suggest that lumenal space contracts during HOS so as to hinder the movement of docking to PS I of plastocyanin or cytochrome c(6).


Figures

Figure 1
Figure 1
Inhibition of PC to P700+ electron transfer by HOS. C. reinhardtii cells were incubated in the dark for 20 min in the presence (white symbols) or absence (black symbols) of 0.3 m Suc and in the presence (circles) or absence (squares) of 10 μm 2,5-dibromo-3-methyl-6 isopropyl-p-benzoquinone (DBMIB). Changes in P700 absorbance (i.e. −ΔI/I) during steady-state illumination (approximately 100 μmol photons m−2 s−1) were measured at 820 nm. Illumination began at the zero time point and continued for 1.5 s. All values were normalized the maximum 820-nm absorbance change in the presence of DBMIB (white squares) and then plotted as a function of time.
Figure 2
Figure 2
Inhibition of cytochrome f oxidation by HOS. Dark-adapted cells were incubated for 20 min in darkness in the presence of 0.01 mm (black squares), 0.08 m (white squares), or 0.16 m (black circles) potassium phosphate, pH 7.0. Single-turnover flash-induced cytochrome f absorbance signals (i.e. −ΔI/I) were monitored as described in “Materials and Methods.” Chlorophyll concentrations were between 25 and 50 μg chlorophyll mL−1 for all assays. Data from each preparation were scaled to the total photooxidizable cytochrome f concentration in the presence of DBMIB, as described in “Materials and Methods,” and it was assumed that all cytochrome f was reduced in the darkness, prior to flash excitation. Note break in time axis at 27 ms.
Figure 3
Figure 3
Inhibition of P700+ reduction by HOS. Cells were incubated for 20 min in darkness in Tris-acetate-photosphate (TAP) medium (see “Materials and Methods”) containing no Glc (black squares), 0.2 m Glc (white squares), 0.25 m Glc (black circles), 0.3 m Glc (white circles), or 0.3 m Glc, 1 μm phenazine methosulfate (PMS), and 1 mm ascorbate (black triangles). Single-turnover flash-induced 703 to 730 absorbance (i.e. −ΔI/I) changes were measured as described in “Materials and Methods” and normalized against the maximal changes observed in control cells containing 10 μm DBMIB.
Figure 4
Figure 4
Time course of the inhibition of P700+ reduction by HOS. A, Dark-adapted cells were mixed with Suc to final concentrations of 0.15 (black squares), 0.25 (white squares), 0.3 (white circles), and 0.4 (black triangles) m Suc. Ten minutes after the addition of Suc, part of the 0.3 m Suc incubation was centrifuged and resuspended in fresh TAP medium (black circles). At various times following Suc addition, kinetic traces of 703 to 730 absorbance changes (as shown in Fig. 3) were collected. The extents of P700+ signals at 10 ms after a single actinic, normalized to the maximal extent of P700+ obtained after 10 actinic flashes in the presence of DBMIB are presented. B, The same experiment was repeated with KCl at final concentrations of 0.1 m (black squares), 0.15 m (white squares), 0.2 m (white circles), 0.25 m (black triangles), and 0.2 m (diamonds). Ten minutes after the addition of KCl, part of the sample was centrifuged and resuspended in fresh TAP medium (black circles).
Figure 5
Figure 5
Concentration dependence of inhibition of P700+ reduction. Dark-adapted cells were incubated in the dark in the presence of Suc (black squares), Glc (white squares), KCl (black circles), NaCl (white circles), and K2HPO4 (black triangles). After 20 min, flash-induced 703 to 730 absorbance changes (i.e. −ΔI/I) were measured. The fractions P700+ remaining oxidized 10 ms after a saturating flash is plotted against the concentration of solute. Absorbance values were normalized to the maximum value after a series of 10 flashes in the presence of 10 μm DBMIB.
Figure 6
Figure 6
HOS-induced changes in thylakoid ultrastructure. Cells were fixed in the absence (A) or presence (B) of 0.3 m Suc. Thin sections of the cells embedded in SPURRS were negatively stained with uranyl acetate and the images were obtained using a JEOL JEM 1200-EX microscope (JEOL, Ltd., Tokyo). The arrow in B shows a transition point where a pair of thylakoid membranes become appressed against each other. See text for details.
Figure 7
Figure 7
Effects HOS on chlorophyll a fluorescence induction curves. A, Cells were dark adapted for 20 min in TAP medium containing no Suc (black squares), 0.1 (white squares), 0.2 (black circles), 0.3 (white circles), or 0.4 (black triangles) m Suc. Chlorophyll a fluorescence yield changes were measured under continuous illumination. In each case, curves were normalized to the maximum fluorescence (Fm) of the corresponding treatments containing 10 μm atrazine. Fluorescence yield, expressed in units of fractional fluorescence, F/Fm, is plotted against time after the start of illumination. B, The dependence on Suc concentration of steady-state (taken at 16.5 s after onset of illumination) variable fluorescence levels, presented in arbitrary units, steady-state fluorescence level (Fs, white squares) and maximum fluorescence levels (Fm, white circles). The steady-state fluorescence yield is also depicted; Fs normalized to Fm (black squares), expressed in fractional fluorescence units, F/Fm. Also shown is the dependence of fluorescence yield at the peak of phase I (taken at 90 ms after the start of illumination), Fi, normalized to Fm (black triangles).
Figure 8
Figure 8
Effects of HOS on single-turnover flash-induced fluorescence changes. A, Cells were incubated in darkness in TAP medium in the presence of no Suc (black squares), 0.1 (white squares), 0.2 (black circles), 0.3 (white circles), or 0.4 (black triangles) m Suc. After 20 min, flash-induced fluorescence kinetics were measured as described in “Materials and Methods.” For each trace, FV (variable fluorescence) was normalized to F0 (baseline fluorescence of the dark-adapted sample) and FV/F0 was plotted against time (on a log10 scale). B, The samples in A were subsequently treated with a final concentration of 100 μm p-benzoquinone to oxidize PQH2 and, after a minimum 5-min dark adaptation, the flash-induced fluorescence kinetics experiments were repeated. Symbols are as in A.

Similar articles

Cited by

References

    1. Albertsson P-A. Interaction between the lumenal sides of the thylakoid membrane. FEBS Lett. 1982;149:186–190.
    1. Allakhverdiev SI, Sakamoto A, Nishiyama Y, Inaba M, Murata N. Ionic and osmotic effects of NaCl-induced inactivation of photosystems I and II in Synechococcus sp. Plant Physiol. 2000a;123:1047–1056. - PMC - PubMed
    1. Allakhverdiev SI, Sakamoto A, Nishiyama Y, Murata N. Inactivation of photosystems I and II in response to osmotic stress in Synechococcus: contributions of water channels. Plant Physiol. 2000b;122:1201–1208. - PMC - PubMed
    1. Allen JF, Holmes NG. Electron transport and redox titration. In: Hipkins MF, Baker NR, editors. Photosynthesis: Energy Transduction, A Practical Approach. Oxford: IRL Press Limited; 1986. pp. 103–141.
    1. Bennoun P. Evidence for a respiratory chain in the chloroplast. Proc Natl Acad Sci USA. 1982;79:4352–4356. - PMC - PubMed

Publication types

MeSH terms

LinkOut - more resources