

doi: 10.1073/pnas.241500798.
Epub 2001 Nov 13.
Diversity of gene expression in adenocarcinoma of the lung
Affiliations
- PMID: 11707590
- PMCID: PMC61119
- DOI: 10.1073/pnas.241500798
Item in Clipboard
Diversity of gene expression in adenocarcinoma of the lung
Proc Natl Acad Sci U S A.
.
Erratum in
- Proc Natl Acad Sci U S A 2002 Jan 22;99(2):1098
Abstract
The global gene expression profiles for 67 human lung tumors representing 56 patients were examined by using 24,000-element cDNA microarrays. Subdivision of the tumors based on gene expression patterns faithfully recapitulated morphological classification of the tumors into squamous, large cell, small cell, and adenocarcinoma. The gene expression patterns made possible the subclassification of adenocarcinoma into subgroups that correlated with the degree of tumor differentiation as well as patient survival. Gene expression analysis thus promises to extend and refine standard pathologic analysis.
Figures
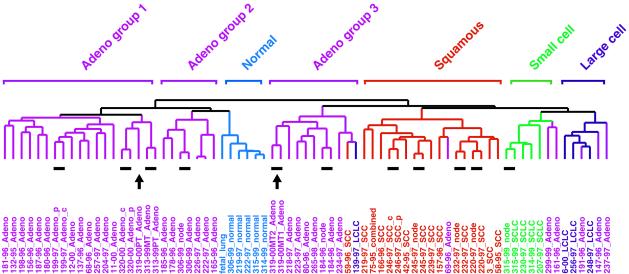
Patterns of gene expression correspond to the major morphological classes of lung tumors. A total of 73 lung tissues were sorted by hierarchical clustering based on similarity in gene expression. AC groups 1, 2, and 3 clustered separately, as indicated above the branches. Patient identification number, the year in which the tumor was resected, and the classification of the tumor by the pathologist (color-coded for simplicity) are shown directly below the corresponding branch of the dendogram. Patient 75–95 was diagnosed with combined LCLC/SCLC (combined). Where indicated, tumor pairs corresponded to primary tumor/lymph node (node), central (c)/peripheral (p) biopsy from the same primary tumor, or primary tumor (PT)/intrapulmonary metastases (MT), all taken from the same patient at the same time. Resected human lung cancer tissue was derived from untreated patients at Charite hospital in Berlin. Only four patients, identified as 3, 6, 11, and 12, were obtained from Stanford Medical Center. The 11 tumor pairs (short lines) and the primary tumor/intrapulmonary metastases from patient 319 (arrows) are indicated immediately below the dendogram branches.
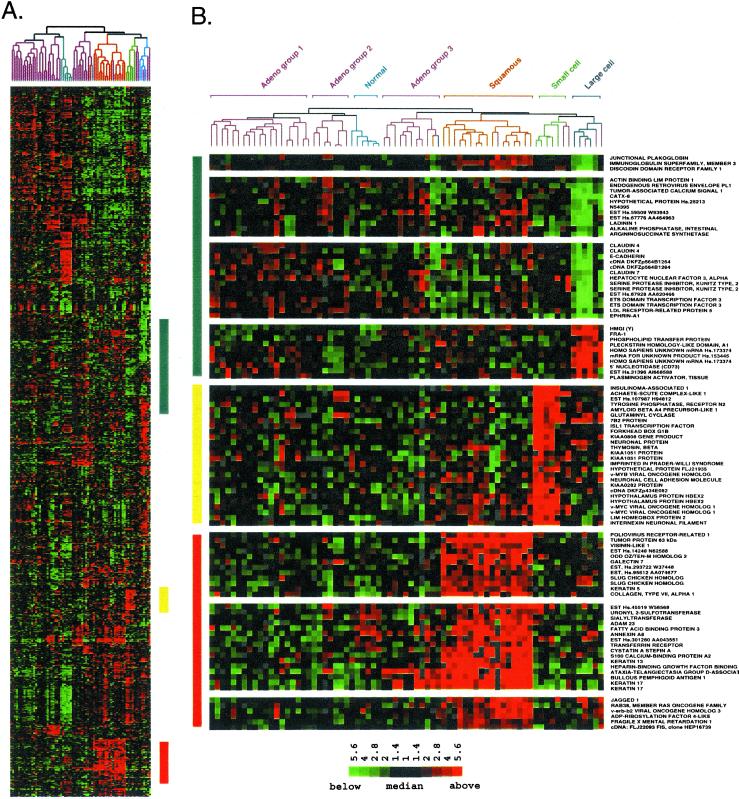
Squamous, small cell, and large cell lung tumors express a unique set of genes. (A) Hierarchical clustering sorted 918 cDNA clones and 73 lung tissues based on similarity in gene expression. Gene clusters relevant to lung tumor types were extracted from the larger cluster of 918 clones in the regions indicated by the colored bars and expanded on the right to include gene names. A row in the cluster indicates expression of a specific gene across all 73 lung tissues. A column indicates the tissue in which the gene is expressed. Red, green, and black squares indicate that expression of the gene is greater than, less than, or equal to the median level of expression across all 73 lung tissues, respectively. Gray represents missing or poor quality data. (B) (Top) Gene clusters relevant to large cell tumors (blue bar). (Middle) Gene clusters relevant to small cell tumors (yellow bar). (Bottom) Gene clusters relevant to squamous lung tumors (red bar). The scale bar reflects the fold increase (red) or decrease (green) for any given gene relative to the median level of expression across all samples.
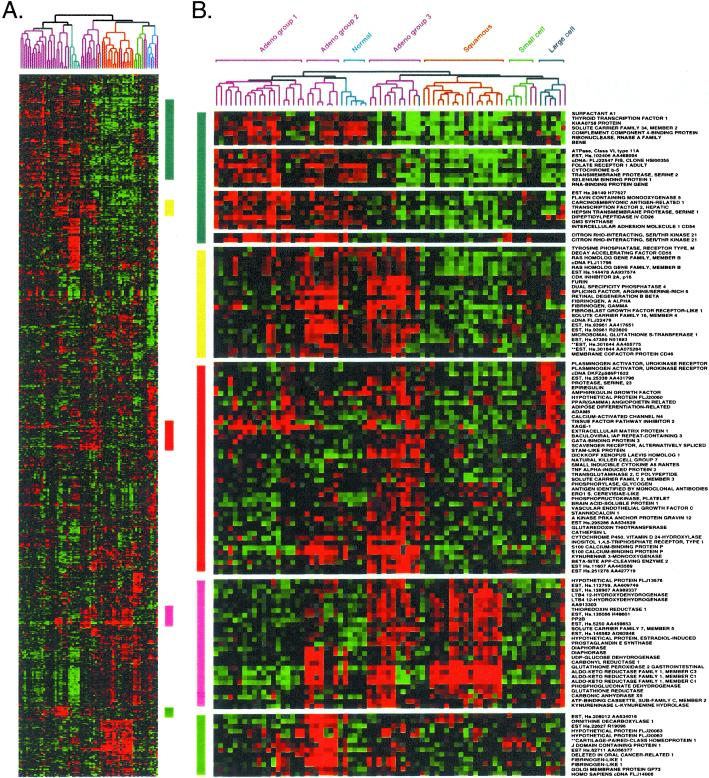
The three AC subgroups express a characteristic set of genes. (A) Cluster of 73 lung tissues and 918 cDNA clones, exactly as shown in Fig. 2A. (B) Gene clusters relevant to AC subgroups were extracted from the larger cluster as described in Fig. 2.
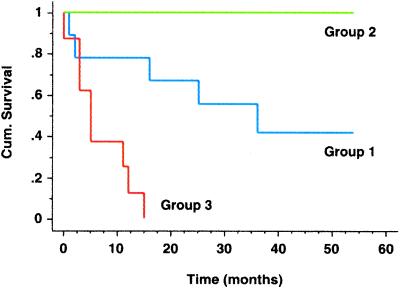
Kaplan–Meier curves show differences in survival for AC subgroups. AC groups 1–3 were defined by hierarchical clustering (see Fig. 1). Cumulative survival, plotted on the y axis, represents percentage of patients living for the indicated times.
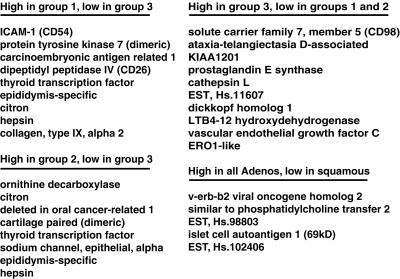
Tumor-specific markers correlate with the three AC subgroups as defined by hierarchical clustering. Selection criteria were based on strong expression (high) in one group yet poor expression (low) in other AC or squamous tumors (see Materials and Methods, which is published as supporting information), as indicated above the list.
References
-
- Travis W, Colby T, Corrin B, Shimosato Y, Brambilla E. WHO International Histological Classification of Tumors: Histological Typing of Lung and Pleural Tumors. Heidelberg: Springer; 1999.
-
- Colby T V, Koss M N, Travis W D. Atlas of Tumor Pathology (3rd Series Fascicle 13): Tumors of the Lower Respiratory Tract. under the auspices of Universities Associated for Research and Education in Pathology, Washington, DC: Armed Forces Institute of Pathology; 1995.
-
- Alizadeh A A, Eisen M B, Davis R E, Ma C, Lossos I S, Rosenwald A, Boldrick J C, Sabet H, Tran T, Yu X, et al. Nature (London) 2000;403:503–511. - PubMed
-
- Perou C M, Sorlie T, Eisen M B, van de Rijn M, Jeffrey S S, Rees C A, Pollack J R, Ross D T, Johnsen H, Akslen L A, et al. Nature (London) 2000;406:747–752. - PubMed
Publication types
MeSH terms
Grants and funding
LinkOut - more resources
Full Text Sources
Other Literature Sources
Medical
Molecular Biology Databases
