. 2001 Dec;86(6):693-700.
doi: 10.1136/heart.86.6.693.

Insulin-like growth factor I and II preserve myocardial structure in postinfarct swine

Affiliations

Insulin-like growth factor I and II preserve myocardial structure in postinfarct swine

A A Kotlyar et al. Heart. 2001 Dec.

Abstract

Background: Insulin-like growth factors (IGF) I and II improve myocardial function after coronary occlusion in different animal models.

Objectives: To investigate the mechanism of improved myocardial function after administration of IGF-I or IGF-II in acute myocardial infarction.

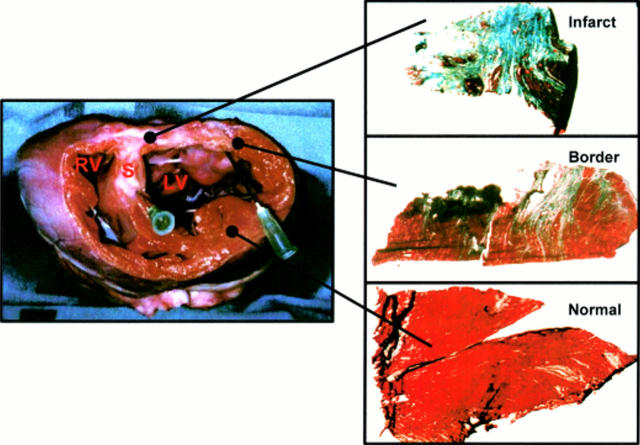
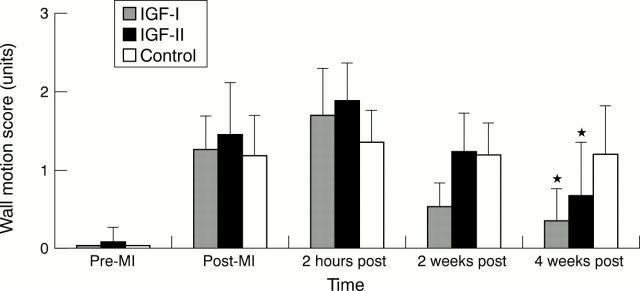
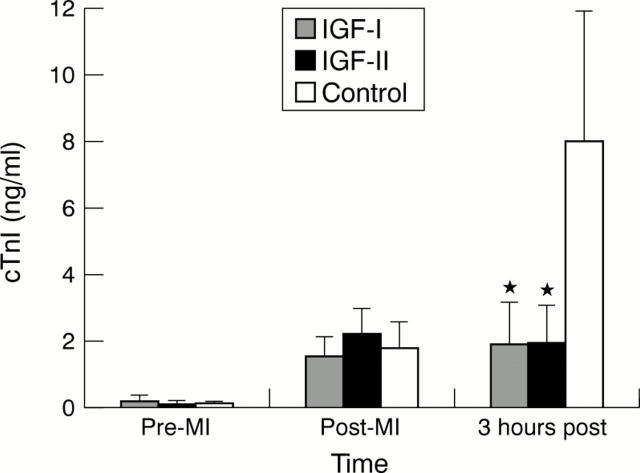
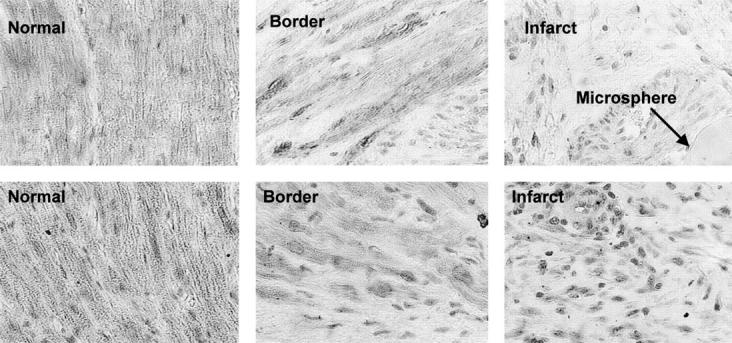
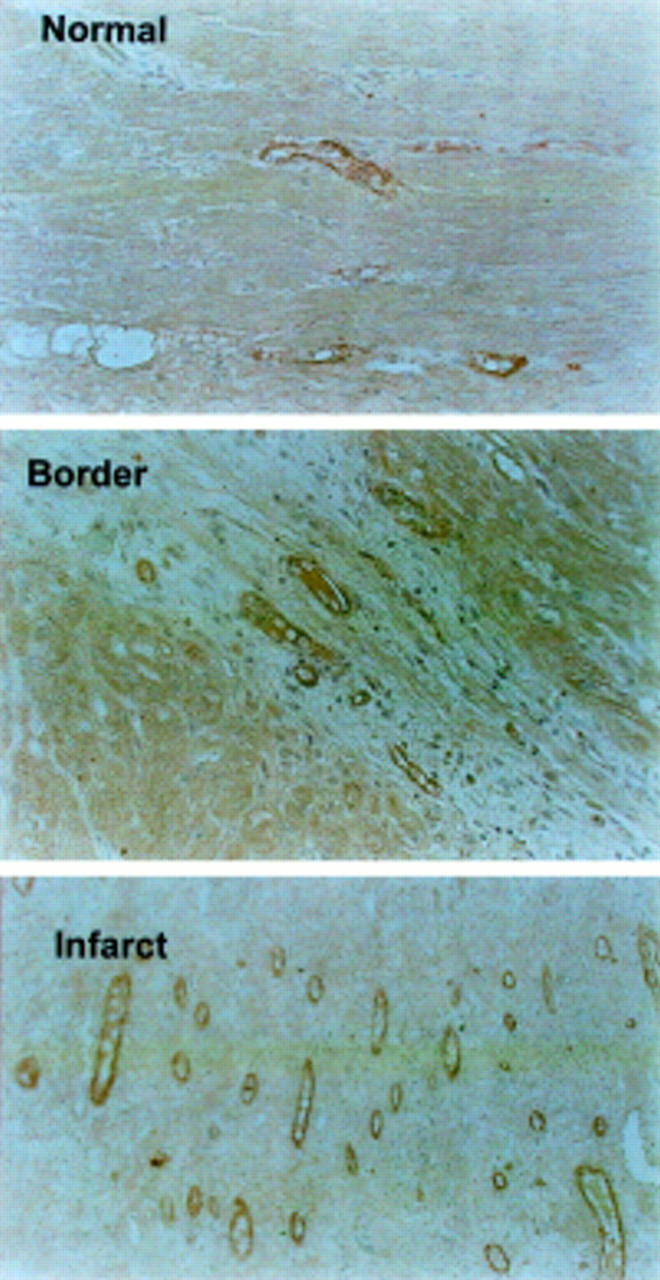
Methods: Female pigs (mean (SD) weight 25 (5) kg) were subjected to acute myocardial infarction by microembolisation with 75-150 micrometer affigel blue beads. The beads contained and slowly released 150 microgram/pig of IGF-I (n = 6), IGF-II (n = 6), or pig albumin (n = 6). Echocardiography, perfusion imaging, and haemodynamic measurements were performed before infarction and during four weeks after infarction. Regional wall motion of different left ventricular segments was scored semiquantitatively on the basis of a three point scoring system, from normal = 0 to dyskinesia = 3. Serum cardiac troponin I concentration was measured before, immediately after, and three hours after the infarct. Excised hearts were analysed for actin, desmin, blood vessel density, and DNA laddering within the infarct, border, and normal myocardial areas.

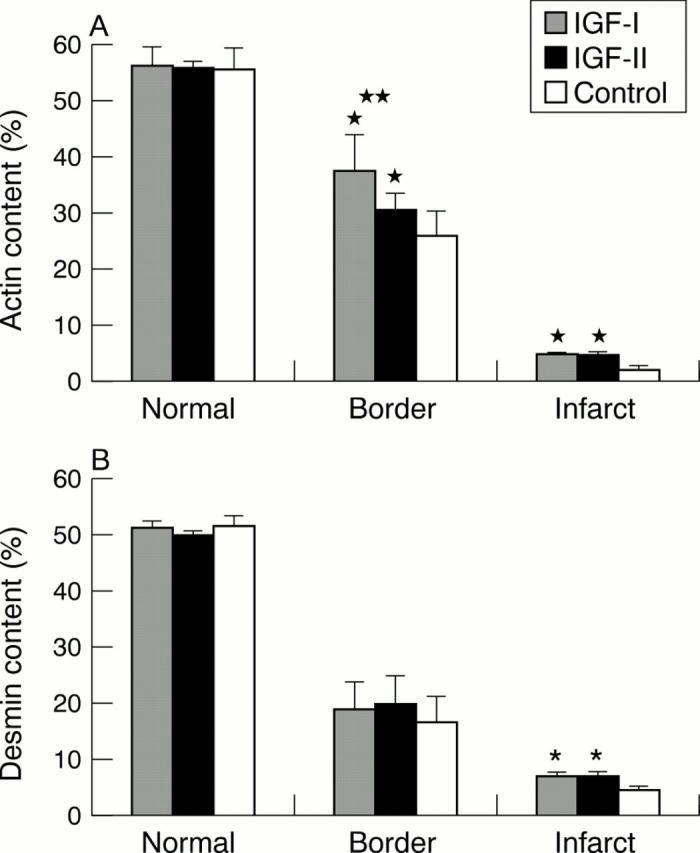
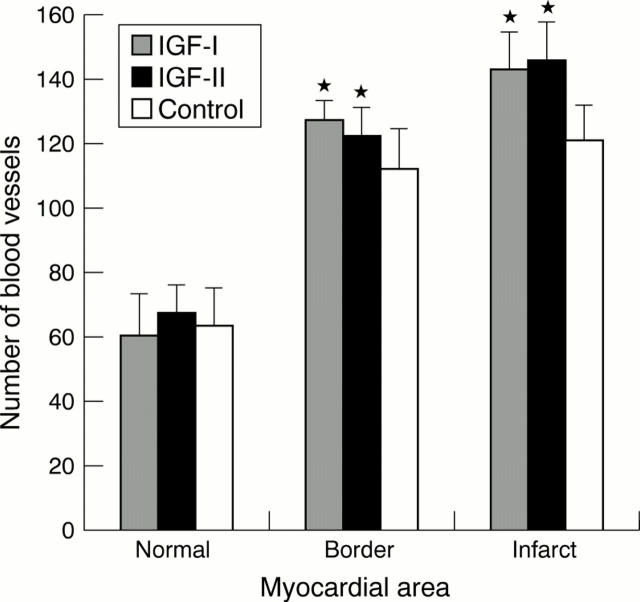
Results: Myocardial function of the infarct related area improved significantly during the four weeks of follow up in both the IGF groups (p = 0.01). Myocardial perfusion, heart rate, and blood pressure were similar in all the animals during the study. Treated animals had lower serum cardiac troponin I concentration (p = 0.001), more actin in the border area (p = 0.01) and infarct area (p = 0.0001), and reduced DNA laddering in the infarct area compared with the controls (p < 0.05). IGF groups had more blood vessels in the border area (p = 0.04) and the infarct area (p = 0.003).

Conclusions: Both types of IGF improved myocardial function and the improvement was associated with preservation of myocardial structure. IGF-I was more effective than IGF-II.


Figures

Figure 1
Figure 1
Example of macroscopic (left panel) and microscopic (right panel) examination. Infarct, border, and normal myocardium stained with Masson-trichrome: viable myocardium stains red, collagen stains blue (magnification ×200). Macroscopic picture shows the left ventricle (LV), right ventricle (RV), and septum (S). White area of the left ventricle represents scar tissue from which the "infarct" tissue sample was taken. The "normal" tissue sample was taken from the contralateral wall, and the "border" tissue sample from the area bridging the scar and the normal myocardium.
Figure 2
Figure 2
Comparison of myocardial wall motion abnormality in IGF-I, IGF-II, and control groups during the four week follow up period. Pre-MI, baseline; post-MI, immediately after myocardial infarction; 2 hours post, two hours after infarction; 2 weeks post, two weeks after infarction; 4 weeks post, four weeks after infarction. *Significant difference from control group, p = 0.01.
Figure 3
Figure 3
Comparison of serum cardiac troponin I (cTnI) concentrations in IGF-I, IGF-II, and control groups at baseline (pre-MI), immediately after myocardial infarction (post-MI), and three hours after infarction (3 hours post-MI). *Significant difference from control, p = 0.001.
Figure 4
Figure 4
Immunostaining with monoclonal mouse IgG2a α-actin (upper panel) and monoclonal mouse IgG1 κ α-desmin (lower panel) of normal, border, and infarct areas. Lower staining intensity is observed within infarcted and border myocardial areas than in the normal area. A typical affigel blue bead microsphere is also shown.
Figure 5
Figure 5
(A) Comparison of the actin content in the normal, border, and infarct myocardial areas of IGF-I, IGF-II, and control groups. *Significant difference from control group in the border area (p = 0.01) and the infarct area (p = 0.0001). **Significant difference between IGF-I and IGF-II groups in the border area (p = 0.03). (B) Comparison of desmin content in the normal, border, and infarct areas of IGF-I, IGF-II, and control groups. *Significant difference from control group in the infarct area (p = 0.0002).
Figure 6
Figure 6
Immunostaining with factor VIII (Von Willebrand factor, VWF) antibody of normal, border, and infarct areas. Larger numbers of positively stained endothelial cells are seen within the infarcted myocardial area than in the border and normal areas.
Figure 7
Figure 7
Comparison of blood vessel density in the normal, border, and infarct myocardial areas of IGF-I treated, IGF-II treated, and control groups. *Significant difference from control group in the border (p = 0.04) and infarct areas (p = 0.003).
Figure 8
Figure 8
Gel electrophoresis of DNA strand breaks (a-f) using ligation mediated polymerase chain reaction. Lanes a, b, and c represent normal, border, and infarct areas, respectively, from a representative control animal. Lanes d, e, and f represent normal, border, and infarct areas, respectively, from a representative IGF-I treated animal. The right lane represents a 123 base pair ladder of double stranded DNA (D-5042, Sigma).

References

    1. J Am Soc Echocardiogr. 1989 Sep-Oct;2(5):358-67 - PubMed
    1. Circ Res. 1999 May 14;84(9):1007-19 - PubMed
    1. Cancer Res. 1998 Sep 1;58(17):4008-14 - PubMed
    1. Am J Pathol. 1995 Jan;146(1):3-15 - PubMed
    1. N Engl J Med. 1997 Feb 27;336(9):633-40 - PubMed

MeSH terms