. 2001 Nov 15;537(Pt 1):35-44.
doi: 10.1111/j.1469-7793.2001.0035k.x.

Low threshold T-type calcium current in rat embryonic chromaffin cells

Affiliations

Low threshold T-type calcium current in rat embryonic chromaffin cells

R Bournaud et al. J Physiol. .

Abstract

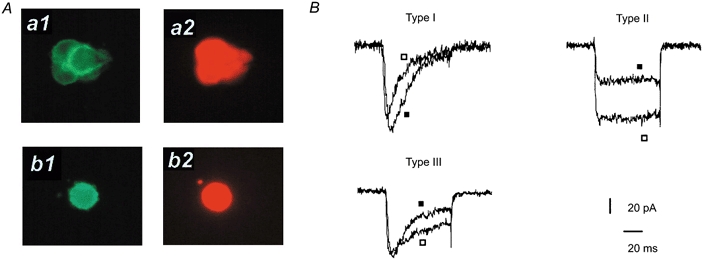
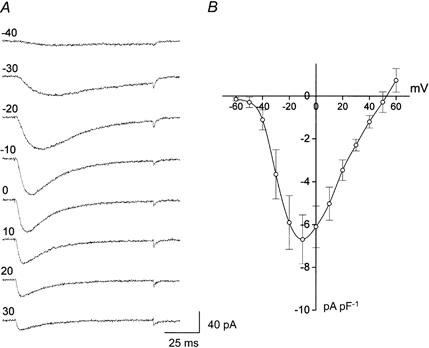
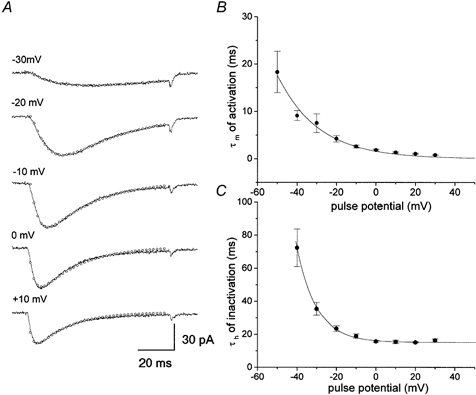
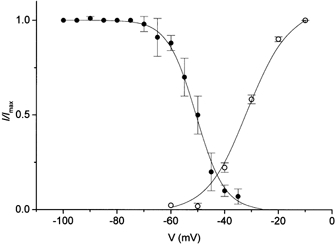
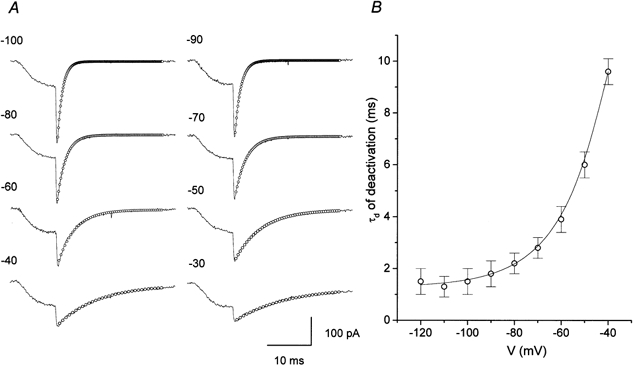
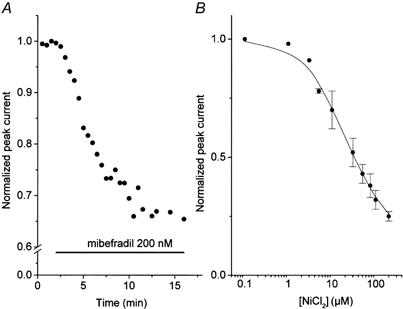
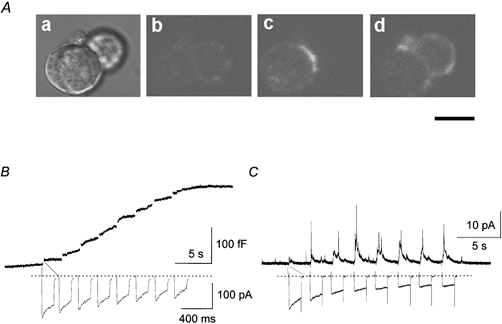
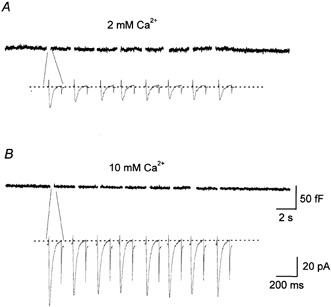
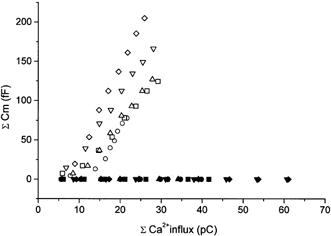
1. The gating kinetics and functions of low threshold T-type current in cultured chromaffin cells from rats of 19-20 days gestation (E19-E20) were studied using the patch clamp technique. Exocytosis induced by calcium currents was monitored by the measurement of membrane capacitance and amperometry with a carbon fibre sensor. 2. In cells cultured for 1-4 days, the embryonic chromaffin cells were immunohistochemically identified by using polyclonal antibodies against dopamine beta-hydroxylase (DBH) and syntaxin. The immuno-positive cells could be separated into three types, based on the recorded calcium current properties. Type I cells showed exclusively large low threshold T-type current, Type II cells showed only high voltage activated (HVA) calcium channel current and Type III cells showed both T-type and HVA currents. These cells represented 44 %, 46 % and 10 % of the total, respectively. 3. T-type current recorded in Type I cells became detectable at -50 mV, reached its maximum amplitude of 6.8 +/- 1.2 pA pF(-1) (n = 5) at -10 mV and reversed around +50 mV. The current was characterized by criss-crossing kinetics within the -50 to -30 mV voltage range and a slow deactivation (deactivation time constant, tau(d) = 2 ms at -80 mV). The channel closing and inactivation process included both voltage-dependent and voltage-independent steps. The antihypertensive drug mibefradil (200 nM) reduced the current amplitude to about 65 % of control values. Ni(2+) also blocked the current in a dose-dependent manner with an IC(50) of 25 microM. 4. T-type current in Type I cells did not induce exocytosis, while catecholamine secretion by exocytosis could be induced by HVA calcium current in both Type II and Type III cells. The failure to induce exocytosis by T-type current in Type I cells was not due to insufficient Ca(2+) influx through the T-type calcium channel. 5. We suggest that T-type current is expressed in developing immature chromaffin cells. The T-type current is replaced progressively by HVA calcium current during pre- and post-natal development accompanying the functional maturation of the exocytosis mechanism.


Figures

Figure 1
Figure 1. Characteristics of embryonic chromaffin cells in culture
A, immunohistochemical staining of fetal chromaffin cells with antibodies against syntaxin (a1 and b1) and against dopamine β-hydroxylase (a2 and b2): cell clusters (upper panels) and isolated single cells (lower panels). B, calcium channel currents recorded from the three subtypes of chromaffin cells. Superimposed currents were induced by pulses of 75 ms duration to −10 mV (▪) and +10 mV (□) driven from the holding potential of −80 mV.
Figure 2
Figure 2. T-type current in embryonic chromaffin cells
A, T-type currents were induced by test pulses of 80 ms duration to different potential levels (mV, indicated at left side of each trace), driven from the holding potential of −80 mV. B, current density-voltage relationship of T-type current.
Figure 3
Figure 3. Activation and inactivation time constant of T-type current
A, T-type currents (continuous lines) were fitted by the equation: where I0 is the current offset, Imax is the maximum amplitude of T-type calcium channel current, t0 is the time offset, τm is the activation time constant and τh is the inactivation time constant. B, plot of τmvs. pulse potential. C, plot of τhvs. pulse potential.
Figure 4
Figure 4. Comparison of steady-state inactivation and activation of T-type current
Averaged experimental points for activation (○) and for inactivation (•) were fitted by single Boltzmann equations (continuous lines).
Figure 5
Figure 5. Voltage dependence of channel deactivation
A, exponential fits (○) to tail currents elicited by repolarization potentials indicated at the left of each trace. Current (continuous lines) was activated by a 10 ms depolarization pulse to −10 mV from the holding potential −80 mV. B, plot of averaged time constant of deactivation (τd) vs. repolarizing potential.
Figure 6
Figure 6. Inhibition of T-type calcium channel current by antagonists
A, effect of mibefradil (200 nm) on normalized T-type current amplitude. Application of mibefradil is indicated by a horizontal bar. B, dose-response curve of Ni2+ on T-type currents. Averaged experimental points were fitted by the equation: y = (1 - D)/(1 + ([mibefradil]/IC50)n) +D, where D is the fraction of the drug-resistant current and n is a slope factor. Best fit of the mean value of the responses vs. concentration was obtained with the values: IC50 = 20.5 μm, D = 0.20, n = 0.9. In both cases, current was elicited by a depolarizing pulse to −10 mV from the −80 mV holding potential.
Figure 7
Figure 7. Exocytosis in fetal chromaffin cells
Aa, phase contrast micrograph of fetal chromaffin cells. Ab-Ad, confocal observation of activity-dependent internalization of FM1–43, before (Ab) and after (Ac, Ad) depolarization induced by 70 mm KCl. Ac and Ad were averaged from eight fluorescence images, obtained in two different positions along the z-axis. Scale bar represents 10 μm. B, increase in membrane capacitance induced by HVA calcium current. C, amperometric detection of catecholamine secretion induced by HVA calcium current. In both B and C, HVA calcium currents were evoked by a series of eight 160 ms test depolarization pulses from a holding potential of −80 mV to +10 mV.
Figure 8
Figure 8. Absence of membrane capacitance changes caused by T-type calcium current
Simultaneous recording of T-type calcium current (lower traces) and membrane capacitance (upper traces) in two different external Ca2+ concentrations, 2 mm (A) and 10 mm (B). In both cases, T-type current was elicited by a series of eight depolarizing pulses of 120 ms driven from the holding potential of −80 mV to −10 mV.
Figure 9
Figure 9. Membrane capacitance increase and calcium currents
Cumulative membrane capacitance increases (ordinate) were plotted against total charge (abscissa) carried by HVA calcium currents obtained from Type II cells (n = 5, open symbols) and T-type currents recorded from Type I cells (n = 5, filled symbols). The different symbols represent recordings obtained from different cells.

References

    1. Albillos A, Artalejo AR, López MG, Gandía L, García AG, Carbone E. Calcium channel subtypes in cat chromaffin cells. Journal of Physiology. 1994;477:197–213. - PMC - PubMed
    1. Albillos A, Neher E, Moser T. R-type Ca2+ channels are coupled to the rapid component of secretion in mouse adrenal slice chromaffin cells. Journal of Neuroscience. 2000;20:8323–8330. - PMC - PubMed
    1. Artalejo CR, Adams ME, Fox AP. Three types of Ca2+ channel trigger secretion with different efficacies in chromaffin cells. Nature. 1994;367:72–76. - PubMed
    1. Artalejo CR, Dahmer MK, Perlman RL, Fox AP. Two types of Ca2+ currents are found in bovine chromaffin cells: facilitation is due to the recruitment of one type. Journal of Physiology. 1991;432:681–707. - PMC - PubMed
    1. Artalejo CR, Perlman RL, Fox AP. ω-conotoxin GVIA blocks a Ca2+ current in chromaffin cells that is not of the “classic” N type. Neuron. 1992;8:85–95. - PubMed

Publication types

LinkOut - more resources