

Retrograde modulation of transmitter release by postsynaptic subtype 1 metabotropic glutamate receptors in the rat cerebellum
- PMID: 11711567
- PMCID: PMC2278923
- DOI: 10.1111/j.1469-7793.2001.0125k.x
Retrograde modulation of transmitter release by postsynaptic subtype 1 metabotropic glutamate receptors in the rat cerebellum
Abstract
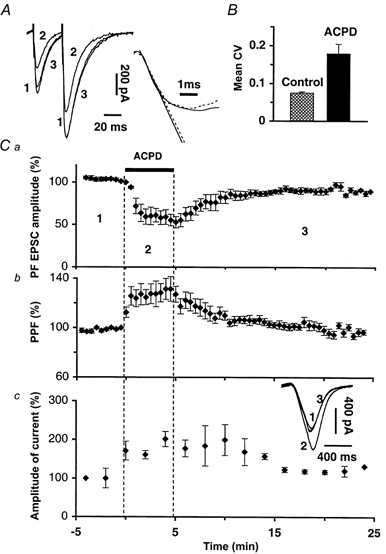
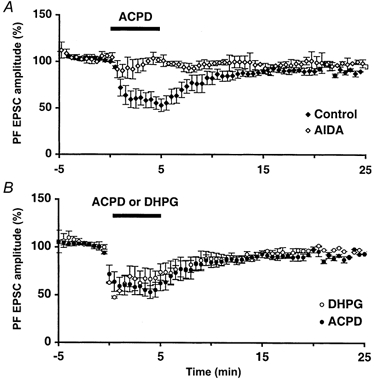
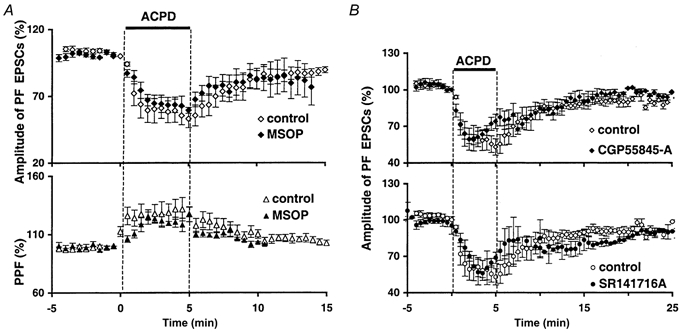
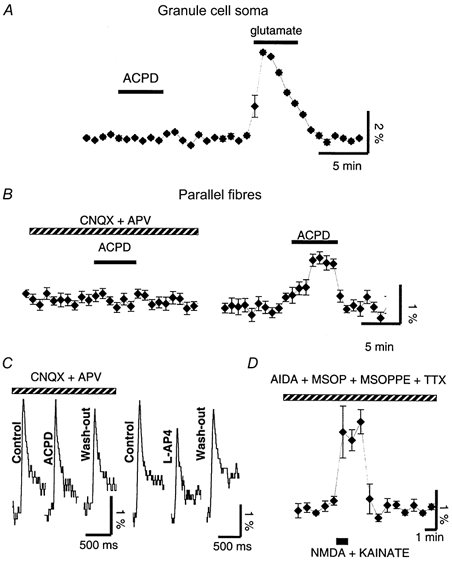
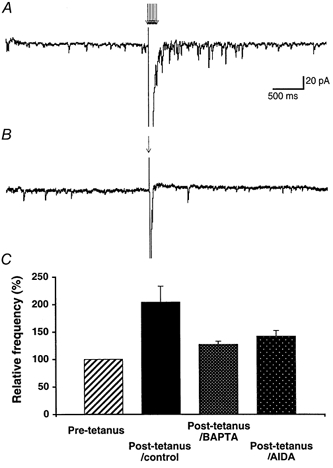
1. The aim of the study was to elucidate the mechanisms underlying the depressant effect of the group I/II metabotropic glutamate receptor (mGluR) agonist 1S,3R-aminocyclopentane-1,3-dicarboxylic acid (1S,3R-ACPD) on parallel fibre (PF) to Purkinje cell (PC) synaptic transmission. Experiments were performed in rat cerebellar slices using the whole-cell patch-clamp technique and fluorometric measurements of presynaptic calcium variation 2. Analysis of short-term plasticity, fluctuation of EPSC amplitude and responses of PCs to exogenous glutamate showed that depression caused by 1S,3R-ACPD is presynaptic. 3. The effects of 1S,3R-ACPD were blocked and reproduced by group I mGluR antagonists and agonists, respectively. 4. These effects remained unchanged in mGluR5 knock-out mice and disappeared in mGluR1 knock-out mice. 5. 1S,3R-ACPD increased calcium concentration in PFs. This effect was abolished by AMPA/kainate (but not NMDA) receptor antagonists and mimicked by focally applied agonists of these receptors. Thus, it is not directly due to mGluRs but to presynaptic AMPA/kainate receptors indirectly activated by 1S,3R-ACPD. 6. Frequencies of spontaneous and evoked unitary EPSCs recorded in PCs were respectively increased and decreased by mGluR1 agonists. Similar results were obtained when mGluR1s were activated by tetanic stimulation of PFs. 7. Injecting 30 mM BAPTA into PCs blocked the effects of 1S,3R-ACPD on unitary EPSCs. 8. In conclusion, 1S,3R-ACPD reduces evoked release of glutamate from PFs. This effect is triggered by postsynaptic mGluR1s and thus implies that a retrograde messenger, probably glutamate, opens presynaptic AMPA/kainate receptors and consequently increases spontaneous release of glutamate from PF terminals and decreases evoked synaptic transmission.
Figures
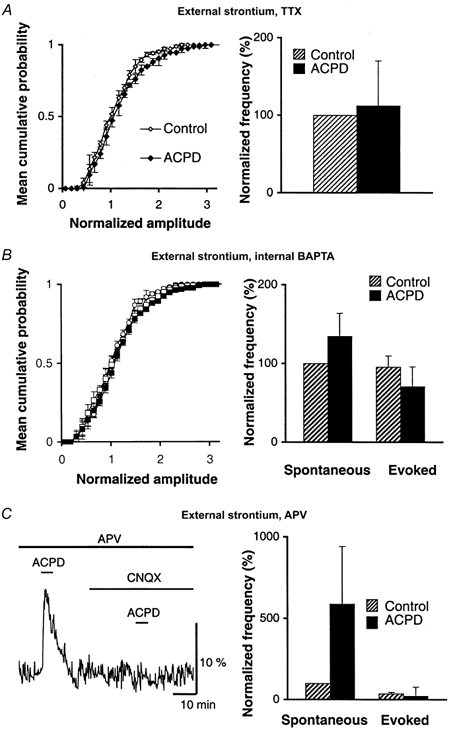
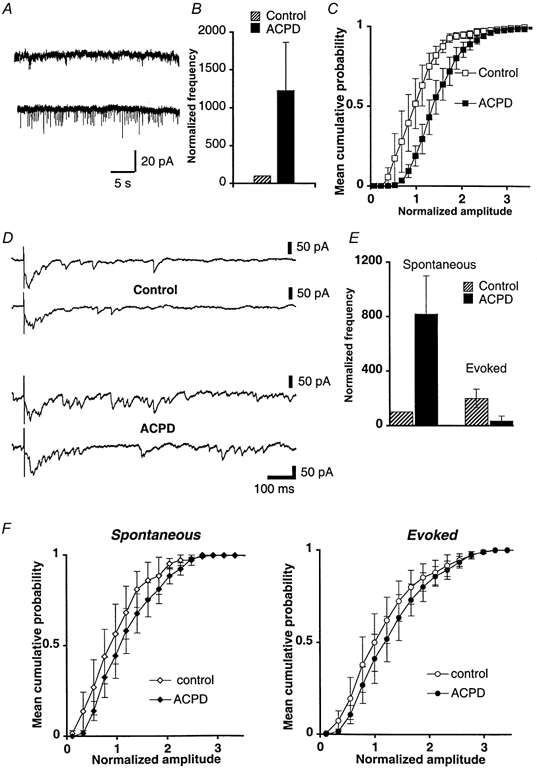
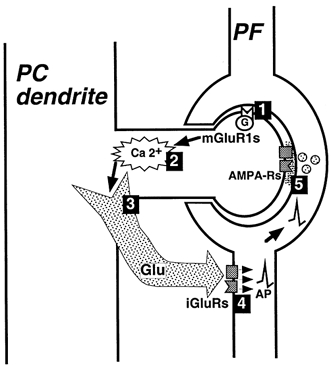
Similar articles
-
Heterologous modulation of inhibitory synaptic transmission by metabotropic glutamate receptors in cultured hippocampal neurons.J Neurophysiol. 1996 Feb;75(2):885-93. doi: 10.1152/jn.1996.75.2.885. J Neurophysiol. 1996. PMID: 8714661
-
Role of metabotropic glutamate (ACPD) receptors at the parallel fiber-Purkinje cell synapse.J Neurophysiol. 1992 Oct;68(4):1453-62. doi: 10.1152/jn.1992.68.4.1453. J Neurophysiol. 1992. PMID: 1432092
-
Evidence for functional metabotropic glutamate receptors in the dorsal cochlear nucleus.J Neurophysiol. 1997 Apr;77(4):1889-905. doi: 10.1152/jn.1997.77.4.1889. J Neurophysiol. 1997. PMID: 9114243
-
Metabotropic glutamate receptors control gating of spike transmission in the hippocampus area CA1.Pharmacol Biochem Behav. 2002 Sep;73(2):307-16. doi: 10.1016/s0091-3057(02)00846-8. Pharmacol Biochem Behav. 2002. PMID: 12117584 Review.
-
Membrane trafficking and positioning of mGluRs at presynaptic and postsynaptic sites of excitatory synapses.Neuropharmacology. 2021 Dec 1;200:108799. doi: 10.1016/j.neuropharm.2021.108799. Epub 2021 Sep 28. Neuropharmacology. 2021. PMID: 34592242 Review.
Cited by
-
Maintenance of presynaptic function by AMPA receptor-mediated excitatory postsynaptic activity in adult brain.Proc Natl Acad Sci U S A. 2005 Dec 27;102(52):19180-5. doi: 10.1073/pnas.0504359103. Epub 2005 Dec 15. Proc Natl Acad Sci U S A. 2005. PMID: 16357208 Free PMC article.
-
Astrocytes display complex and localized calcium responses to single-neuron stimulation in the hippocampus.J Neurosci. 2011 Jun 15;31(24):8905-19. doi: 10.1523/JNEUROSCI.6341-10.2011. J Neurosci. 2011. PMID: 21677174 Free PMC article.
-
Synapses between parallel fibres and stellate cells express long-term changes in synaptic efficacy in rat cerebellum.J Physiol. 2004 Feb 1;554(Pt 3):707-20. doi: 10.1113/jphysiol.2003.055871. Epub 2003 Nov 14. J Physiol. 2004. PMID: 14617674 Free PMC article.
-
Group I metabotropic glutamate receptors inhibit GABA release at interneuron-Purkinje cell synapses through endocannabinoid production.J Neurosci. 2004 May 19;24(20):4865-74. doi: 10.1523/JNEUROSCI.0403-04.2004. J Neurosci. 2004. PMID: 15152047 Free PMC article.
-
Correlation of non-uniform protein expression with variation in transmitter release probability.Synapse. 2005 Feb;55(2):110-21. doi: 10.1002/syn.20079. Synapse. 2005. PMID: 15543629 Free PMC article.
References
-
- Ankri N, Legendre P, Faber D, Korn H. Automatic detection of spontaneous synaptic responses in central neurons. Journal of Neuroscience Methods. 1994;52:87–100. - PubMed
-
- Aroniadou-Anderjaska V, Ennis M, Shipley MT. Dendrodendritic recurrent excitation in mitral cells of the rat olfactory bulb. Journal of Neurophysiology. 1999;82:489–494. - PubMed
Publication types
MeSH terms
Substances
LinkOut - more resources
Full Text Sources