. 2001 Nov 15;537(Pt 1):161-77.
doi: 10.1111/j.1469-7793.2001.0161k.x.

Electrophysiological and morphological properties of pre-autonomic neurones in the rat hypothalamic paraventricular nucleus

Affiliations

Electrophysiological and morphological properties of pre-autonomic neurones in the rat hypothalamic paraventricular nucleus

J E Stern. J Physiol. .

Abstract

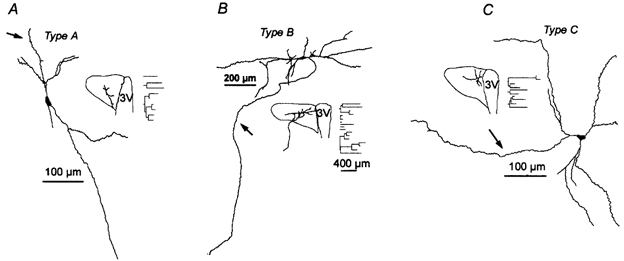
1. The cellular properties of pre-autonomic neurones in the hypothalamic paraventricular nucleus (PVN) were characterized by combining in vivo retrograde tracing techniques, in vitro patch-clamp recordings and three-dimensional reconstruction of recorded neurones in adult hypothalamic slices. 2. The results showed that PVN pre-autonomic neurones constitute a heterogeneous neuronal population. Based on morphological criteria, neurones were classified into three subgroups. Type A neurones (52 %) were located in the ventral parvocellular (PaV) subnucleus, and showed an oblique orientation with respect to the third ventricle (3V). Type B neurones (25 %) were located in the posterior parvocellular (PaPo) subnucleus, and were oriented perpendicularly with respect to the 3V. Type C neurones (23 %) were located in both the PaPo (82 %) and the PaV (18 %) subnuclei, and displayed a concentric dendritic configuration. 3. A morphometric analysis revealed significant differences in the dendritic configuration among neuronal types. Type B neurones had the most complex dendritic arborization, with longer and more branching dendritic trees. 4. Several electrophysiological properties, including cell input resistance and action potential waveforms, differed between cell types, suggesting that the expression and/or properties of a variety of ion channels differ between neuronal types. 5. Common features of PVN pre-autonomic neurones included the expression of a low-threshold spike and strong inward rectification. These properties distinguished them from neighbouring magnocellular vasopressin neurones. 6. In summary, these results indicate that PVN pre-autonomic neurones constitute a heterogeneous neuronal population, and provide a cellular basis for the study of their involvement in the pathophysiology of hypertension and congestive heart failure disorders.


Figures

Figure 1
Figure 1. Identification of PVN pre-autonomic neurones in brain slices using retrograde labelling techniques
A, low-power photomicrograph depicting the retrograde tracer injection site at the level of the DVC. Two images (bright light and fluorescence light) were taken from the same section and superimposed, to show clearly the location and extension of the DiI injection (red area, arrow). B, confocal digital image of DiI-labelled neurones in a coronal slice (300 μm) containing the PVN (at the level of the PaV subnucleus). Slices were obtained 7 days after an injection of DiI into the DVC. Note that most of the labelling was unilateral. C, example of a PVN DiI-labelled neurone at higher magnification. D, photomicrograph of the same neurone as in C after ABC-DAB staining. E, for morphometric analysis, the neuronal dendritic tree was traced and reconstructed in three dimensions using a computer-assisted program (see Methods). 3V, third ventricle; CC, central canal.
Figure 2
Figure 2. Morphological subtypes of PVN pre-autonomic neurones
A–C, typical examples of type A, B and C PVN pre-autonomic neurones, respectively. Arrows point to the axons. In the insets, neurones were scaled to the same proportion. Their location within the PVN and their respective dendrograms are displayed.
Figure 3
Figure 3. Typical features of PVN pre-autonomic type A, B and C neurones
Examples of PVN pre-autonomic neurone types A (A1-A3), B (B 1-B 3) and C (C 1-C 3) located in the PaV (A1) and in the PaPo (B 1 and C 1) subnuclei, respectively. A2-C 2, photomicrographs corresponding to the boxed areas shown in A1-C 1, respectively. Arrows point to the axons. Note that the axon in the type A (A2) neurone shown originated from a proximal dendrite, whereas the axon in the type B (B 2) and type C (C 2) neurones shown originated from the soma. A3-C 3, electrophysiological recordings obtained from the same neurones. Low-threshold spikes (LTSs; arrows), were evoked by depolarizing pulses (0.05–0.07 nA) while clamping the neurones at approximately −80 mV (upper traces), or at the offset of hyperpolarizing pulses (-0.05 to −0.07 nA), while clamping the neurones at approximately −50 mV (lower traces). Note also the presence of an inward sag during the hyperpolarizing pulses (arrowheads in lower trace).
Figure 7
Figure 7. Voltage dependency and Ni2+ sensitivity of LTSs in PVN pre-autonomic neurones
A, example of LTSs and bursts of action potentials in a type A PVN pre-autonomic neurone evoked with two incremental depolarizing current steps (A1 and A2). A portion of both traces superimposed and expanded is shown in the inset (the arrow corresponds to A2). Note the decreased latency for evoked action potentials during the larger current injection. B, voltage dependency of LTS amplitude. At a membrane potential of approximately −80 mV, a fully activated LTS is evoked, inducing a short burst of action potentials (B 1). As the holding potential is depolarized to approximately −60 mV, the LTS and burst amplitude are diminished (B 2), and eventually disappear (at a membrane potential of approximately −50 mV), resulting in a tonic firing activity (B 3). Traces were obtained from a type B neurone. Action potentials in A and B are truncated. C, example of the LTS sensitivity to low concentrations of Ni2+ (50 μm). LTSs were evoked either by a depolarizing step from hyperpolarized membrane potentials (C 1) or at the offset of hyperpolarizing pulses from depolarized membrane potentials (C 2). Note the complete blockade after 5 min exposure to 50 μm Ni2+ (arrows in C 1 and C 2). The membrane potentials shown indicate the initial holding potential.
Figure 4
Figure 4. Morphometric analysis of the dendritic organization of PVN pre-autonomic neurones
A, the number of primary dendrites and dendritic branches was significantly larger in type B neurones as compared to the other groups (*P < 0.001 and #P < 0.02). B, the total dendritic length (TDL) was also significantly larger in type B neurones (*P < 0.02). No significant differences in mean dendritic length (MDL) and mean path length (MPL) were observed among neuronal types. C, frequency distribution of the number of branches into branch orders in PVN pre-autonomic neurones. In all neuronal types, most branches corresponded to the second-order type. D, plot of the number of dendritic intersections as a function of the distance from the soma in PVN pre-autonomic neurones (Sholl's analysis; Sholl, 1953). Note the more distal extension of dendrites in type B and C neurones. The inset shows a diagram depicting the use of the Sholl method. Concentric spheres of a constant interval of 20 μm, with the centre of the soma as the origin, were drawn for each tracer-filled neurone, and the number of dendritic intersections encountered within each sphere was counted.
Figure 5
Figure 5. PVN pre-autonomic neurones displayed inwardly rectifying current-voltage relationships in response to hyperpolarizing pulses
A–C, examples of fast (A), and time-dependent inward rectification (B and C) in PVN pre-autonomic neurones. Note the absence of a depolarizing sag during the hyperpolarizing pulses in A. The lower panels show the current-voltage relationships obtained at the peak (•) and at steady state (▪) during the hyperpolarizing pulses.
Figure 6
Figure 6. General properties of LTSs in PVN pre-autonomic neurones
A, LTSs with varying shapes (arrows), including fast spikes (A1), slow humps (A2) and long-lasting plateaus (A3), were observed in PVN pre-autonomic neurones. In order to isolate LTSs, recordings were done in the presence of TTX (0.5 μm). Examples in A1-A3 were obtained from type A, B and C PVN pre-autonomic neurones, respectively. B, the LTS threshold was significantly more hyperpolarized in type B neurones (*P < 0.05). On the other hand, the LTS amplitude was similar among PVN pre-autonomic neuronal types (P > 0.05; C).
Figure 8
Figure 8. Correlation between LTS and dendritic structure in PVN pre-autonomic neurones
A–C, examples of reconstructed type A, B and C PVN pre-autonomic neurones, respectively, with their respective evoked LTSs (arrows). Arrowheads point to the axons. D, plot of LTS amplitude vs. TDL. Note the better linear regression fit obtained for type B neurones (type A neurones, r2 = 0.25, P = 0.3; type B neurones, r2 = 0.65, P < 0.05; and type C neurones, r2 = 0.50, P = 0.2).
Figure 9
Figure 9. Spontaneous firing activity in PVN pre-autonomic neurones
Different spontaneous firing patterns were exhibited by PVN pre-autonomic neurones. Shown are typical examples of tonic regular (A), tonic irregular (B) and bursting spiking activity (C). Traces shown in A, B and C were obtained from a type A, B and C neurone, respectively, although these patterns were observed in all three neuronal types. D, pie graphs depicting the incidence of spontaneous activity and firing patterns in the different subtypes of PVN pre-autonomic neurones. No significant differences in the incidence of firing activity or patterns were observed between neuronal types (P > 0.5).
Figure 10
Figure 10. Repetitive firing properties of PVN pre-autonomic neurones
A, PVN pre-autonomic neurones showed varying degrees of spike frequency adaptation (SFA) in response to a 280 ms depolarizing pulse. B, plots of instantaneous firing rate vs. time obtained from traces in A. The time constant of SFA for the type A and C neurones are also shown. Note the little SFA in the type B neurone shown. In this case, the data could not be fitted by an exponential function. No differences in the time course of SFA were observed between neuronal types (see Results). C, examples of after-hyperpolarizations (AHPs; arrows) obtained from the same PVN pre-autonomic neurones as shown in A. The inset in C 3 shows averaged AHP traces (n = 5) obtained from the same neurones, which were scaled to the same peak amplitude to facilitate the comparison of their time course. D, examples of the progressive increase in action potential duration during repetitive firing obtained from the same PVN pre-autonomic neurones as shown in A. The first five action potentials of an evoked train were aligned at action potential onset to show clearly the progressive spike broadening.

References

    1. Andrew RD, Dudek FE. Intrinsic inhibition in magnocellular neuroendocrine cells of rat hypothalamus. Journal of Physiology. 1984;353:171–185. - PMC - PubMed
    1. Armstrong WE, Smith BN, Tian M. Electrophysiological characteristics of immunochemically identified rat oxytocin and vasopressin neurones in vitro. Journal of Physiology. 1994;475:115–128. - PMC - PubMed
    1. Armstrong WE, Warach S, Hatton G, McNeill T. Subnuclei in the rat hypothalamic paraventricular nucleus: a cytoarchitectural horseradish peroxidase and immunocytochemical analysis. Neuroscience. 1980;5:1931–1958. - PubMed
    1. Badoer E, Oldfield BJ, McKinley MJ. Haemorrhage-induced production of Fos in neurons of the lamina terminalis: role of endogenous angiotensin II. Neuroscience Letters. 1993;159:151–154. - PubMed
    1. Bains JS, Ferguson AV. Paraventricular nucleus neurons projecting to the spinal cord receive excitatory input from the subfornical organ. American Journal of Physiology. 1995;268:R625–633. - PubMed

Publication types

LinkOut - more resources