. 2001 Nov;108(10):1483-94.
doi: 10.1172/JCI13219.

PepT1-mediated epithelial transport of dipeptides and cephalexin is enhanced by luminal leptin in the small intestine

Affiliations

PepT1-mediated epithelial transport of dipeptides and cephalexin is enhanced by luminal leptin in the small intestine

M Buyse et al. J Clin Invest. 2001 Nov.

Abstract

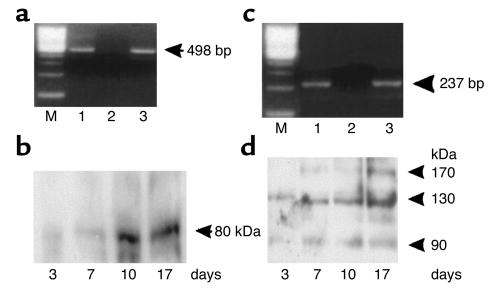
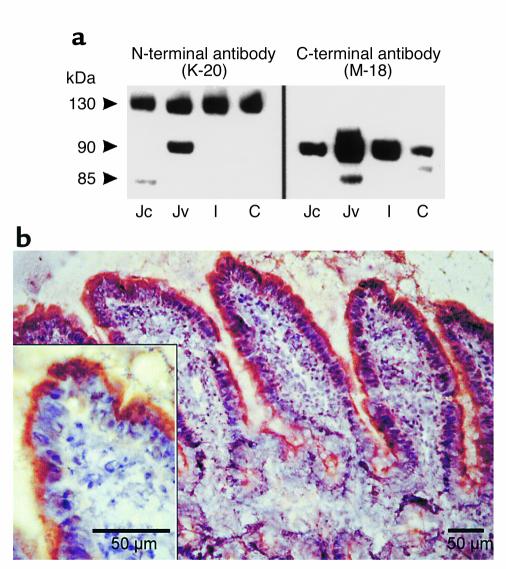
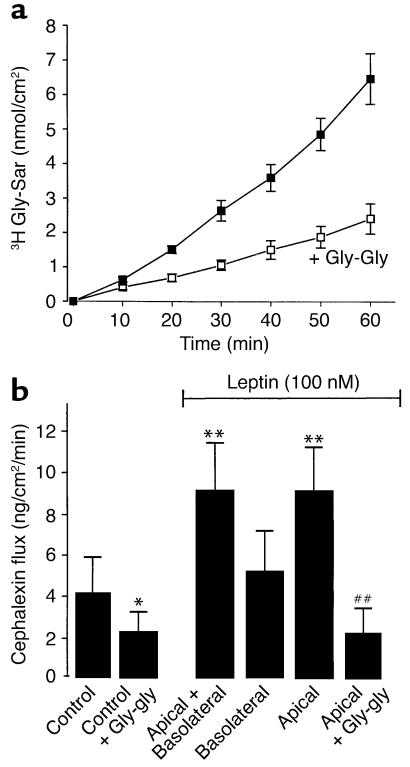
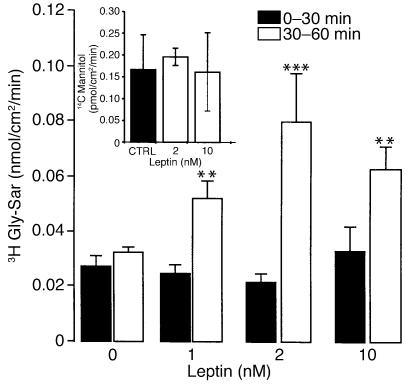
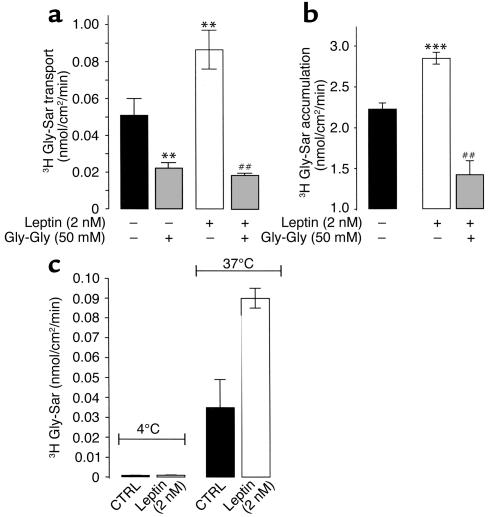
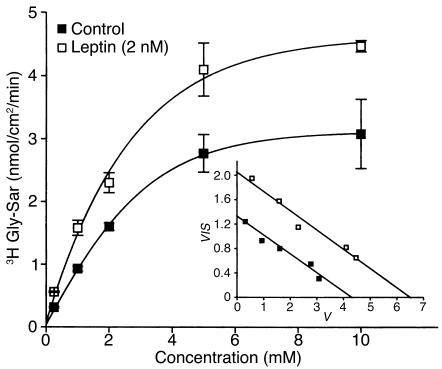
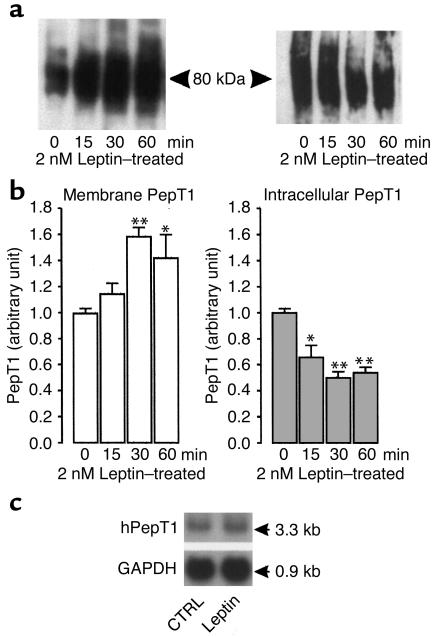
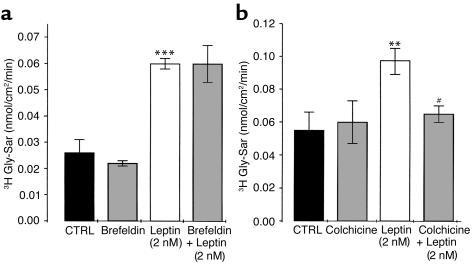
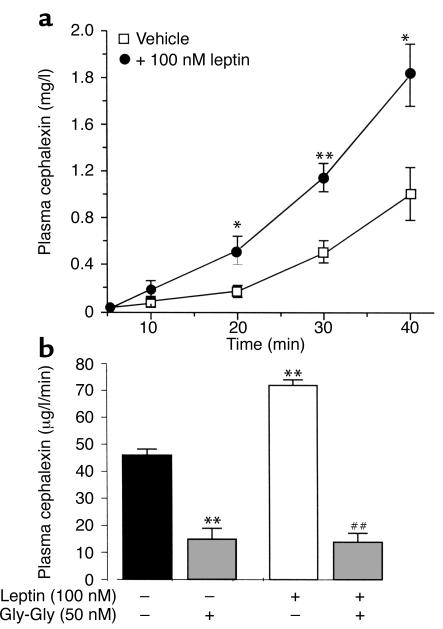
Dietary proteins are mostly absorbed as di- and tripeptides by the intestinal proton-dependent transporter PepT1. We have examined the effects of leptin on PepT1 function in rat jejunum and in monolayers of the human enterocyte-like 2 cell Caco-2. Leptin is produced by the stomach and secreted in the gut lumen. We show here that PepT1 and leptin receptors are expressed in Caco-2 and rat intestinal mucosal cells. Apical (but not basolateral) leptin increased Caco-2 cell transport of cephalexin (CFX) and glycylsarcosine (Gly-Sar), an effect that was associated with increased Gly-Sar uptake, increased membrane PepT1 protein, decreased intracellular PepT1 content, and no change in PepT1 mRNA levels. The maximal velocity (Vmax) for Gly-Sar transport was significantly increased by leptin, whereas the apparent Michaelis-Menten constant (Km) did not change. Furthermore, leptin-stimulated Gly-Sar transport was completely suppressed by colchicine, which disrupts cellular translocation of proteins to plasma membranes. Intrajejunal leptin also induced a rapid twofold increase in plasma CFX after jejunal perfusion with CFX in the rat, indicating enhanced intestinal absorption of CFX. These data revealed an unexpected action of gastric leptin in controlling ingestion of dietary proteins.


Figures

Figure 1
Figure 1
Expression of PepT1 and leptin receptors in Caco-2 cells. Three to seventeen days after cell seeding, total RNA and total protein were extracted and subjected to RT-PCR and Western blot analysis, respectively. (a) RT-PCR of hPepT1 RNA. Lane 1, Caco-2 cells after 3 days of culture. Lane 2, negative control omitting reverse transcriptase. Lane 3, Caco-2 cells after 17 days of culture. Arrow indicates the expected size (498 bp) of the PCR product. (b) Western blot analysis of hPepT1 protein. A polyclonal anti-hPepT1 antibody was used. This representative immunoblot shows a ∼80-kDa protein that varies with the differentiation state of the Caco-2 cells (3 to 17 days of culture). (c) RT-PCR analysis of Ob-Rb RNA. Lane 1, Caco-2 cells after 3 days of culture. Lane 2, negative control omitting reverse transcriptase. Lane 3, Caco-2 cells after 17 days of culture. Arrow indicates the expected size (237 bp) of the PCR product. (d) Western blot analysis of leptin receptor protein. In this representative immunoblot, immunoreactive proteins of approximately 90 kDa, 130 kDa, and 170 kDa were detected in Caco-2 cells.
Figure 2
Figure 2
Expression of leptin receptor proteins in rat intestinal epithelium. (a) Western blot analysis of isolated rat jejunal villus (Jv), jejunal crypt (Jc), ileal (I), and colonic (C) cell extracts with anti–leptin receptor antibodies. At left are representative immunoblots with antibody K-20, an N-terminal leptin receptor antibody that recognizes all leptin receptor isoforms. Immunoreactive proteins of ∼90 and ∼130 kDa were detected. At right are representative immunoblots with antibody M-18, a C-terminal leptin receptor antibody that recognizes only short leptin receptor isoforms. Immunoreactive proteins of ∼85 and ∼90 kDa were detected. (b) Immunostaining of leptin receptor in a frozen section of the rat jejunum. Jejunum sections were prepared and incubated with a C-terminal leptin receptor antibody as described in Methods. Immunostaining was detected in the brush border of enterocytes. Inset: High magnification of the staining at the apex of the jejunal enterocytes. Bar = 50 μm.
Figure 3
Figure 3
Gly-Sar and CFX transport in Caco-2 cells. (a) Time course of basal Gly-Sar transport. Transport of Gly-Sar was measured in confluent monolayers of Caco-2 cells every 10 minutes for 60 minutes at 37°C with continuous circular shaking. The pH was 6.0 in the apical compartment and 7.4 in the basolateral compartment. Gly-Gly (50 mM) decreased basal transport of Gly-Sar. Results are mean ± SEM (n = 6 experiments). (b) Leptin effect on CFX transport in Caco-2 cells. In these experiments, basal CFX transport was measured from 0 to 15 minutes; leptin was added 15 minutes after CFX, and CFX transport in the presence of leptin in either the basolateral or apical compartment, or in both compartments, was measured from time = 15 minutes to time = 30 minutes. For competition studies, Gly-Gly (50 mM) was added at time = 0. Results are mean ± SEM (n = 4 experiments). *P < 0.05 vs. control; **P < 0.01 vs. control. ##P < 0.01 vs. apical leptin.
Figure 4
Figure 4
Dose-response curve of Gly-Sar transport stimulation by leptin. Caco-2 cells were used at day 17. At time = 30 minutes, vehicle (0) or different concentrations of leptin (1–10 nM) were added to the apical compartment containing Gly-Sar. Basal apical to basolateral Gly-Sar or mannitol fluxes were measured between 0 and 30 minutes (Gly-Sar + vehicle or mannitol + vehicle) and compared with fluxes between 30 and 60 minutes (Gly-Sar + leptin or mannitol + leptin) as described in Methods. Inset: Effect of leptin (2 nM and 10 nM) treatment on apical to basolateral flux of 14C mannitol (0,5 μCi/well). Results represent mean ± SEM of six determinations. **P < 0.01 vs. control. ***P < 0.0001 vs. control.
Figure 5
Figure 5
Effect of leptin on Gly-Sar transport and uptake in Caco-2 cell monolayers. Transport (a) or uptake (b) of Gly-Sar were measured in confluent monolayers of Caco-2 cells at day 17 every 10 minutes for 60 minutes with continuous circular shaking. The pH was 6.0 in the apical compartment and 7.4 in the basolateral compartment. Basal apical to basolateral Gly-Sar movement was measured between 0 and 30 minutes (Gly-Sar + vehicle) and compared with fluxes between 30 and 60 minutes (Gly-Sar + leptin) as described in Methods. At the end of the incubation period with 2 nM leptin in the apical compartment, cell monolayer–associated Gly-Sar was determined. Results represent mean ± SEM of six determinations. **P < 0.01 vs. control. ##P < 0.01 vs. apical leptin (2 nM). (c) Temperature dependence (4°C vs. 37°C) of leptin-stimulated apical to basolateral Gly-Sar transport. Results are mean ± SEM of six experiments.
Figure 6
Figure 6
Effect of leptin on kinetic parameters of Gly-Sar transport in Caco-2 cells. Transport of Gly-Sar was measured in confluent monolayers of Caco-2 cells at day 17, every 10 minutes for 60 minutes with continuous circular shaking. The pH was 6.0 in the apical compartment and 7.4 in the basolateral compartment. After 15 minutes of equilibration, Gly-Sar was added to the apical compartment with or without 2 nM leptin. Figure shows apical to basolateral steady-state fluxes of Gly-Sar as a function of apical Gly-Sar concentration in control monolayers and in monolayers treated with 2 nM leptin. Results are mean ± SEM of four experiments. Inset: Eadie-Hofstee plots (V vs. V/S) of Gly-Sar flux, where V is rate of transepithelial flux (nmol/cm2/min) and S is substrate concentration (mM).
Figure 7
Figure 7
Leptin modifies the amount of PepT1 protein in Caco-2 cell monolayers. Confluent Caco-2 cells were incubated for different periods of time with vehicle or 2 nM recombinant murine leptin added to the apical compartment. The Caco-2 cells were washed twice with ice-cold PBS, scraped from the well, and centrifuged. Membrane proteins were extracted as described in Methods. For intracellular extracts, apical and basolateral membranes were excluded by biotinylation. Membranes and intracellular proteins were subjected to Western analysis. (a) Representative immunoblots of hPepT1 protein in membranes of leptin-treated cells (left) and in intracellular extracts from leptin-treated cells (right). A band of ∼80 kDa was detected in each. (b) Densitometric analysis of immunoblots of hPepT1 protein. The changes are expressed as mean ± SEM of three to four analyses. The levels of PepT1 at each incubation time were calculated in relation to the vehicle-treated cells, and the value of each time control was arbitrarily set to 1. *P < 0.05 and **P < 0.01 vs. vehicle. (c) Effect of leptin on abundance of mRNA encoding hPepT1. Caco-2 cells were incubated with vehicle (CTRL) or leptin (2 nM) for 60 minutes. Total mRNA was extracted from control and leptin-treated cells and subjected to Northern blot analysis using 32P-labeled cDNAs encoding hPepT1 and GAPDH.
Figure 8
Figure 8
Colchicine but not brefeldin suppressed leptin-stimulated Gly-Sar transport. (a) Brefeldin (5 μM), (b) colchicine (10 μM), or vehicle (CTRL) was added to Caco-2 cell monolayers for preincubation 2 hours before Gly-Sar was added to the apical compartment at time = 0. At time = 30 minutes, vehicle (CTRL) or leptin (2 nM) was added to the apical compartment containing Gly-Sar. Basal apical to basolateral Gly-Sar fluxes were measured between 0 and 30 minutes (Gly-Sar + vehicle) and compared with fluxes between 30 and 60 minutes (Gly-Sar + leptin) as described in Methods. Results represent mean ± SEM of four determinations. **P < 0.01 and ***P < 0.001 vs. control. #P < 0.01 vs. 2 nM leptin alone.
Figure 9
Figure 9
Leptin increases CFX absorption in vivo. (a) Evolution of plasma concentration of CFX during intrajejunal perfusion with 1 mM CFX (along with vehicle or 100 nM leptin) for 40 minutes. Results represent mean ± SEM in groups of six rats. *P < 0.05 and **P < 0.01 vs. vehicle. (b) Plasma concentration of CFX in the presence of 50 mM Gly-Gly competing for the dipeptide transporter in the jejunal lumen. Results represent mean ± SEM in groups of six rats. **P < 0.01 vs. control. ##P < 0.01 vs. leptin alone.

References

    1. Grimble GK. The significance of peptides in clinical nutrition. Annu Rev Nutr. 1994;14:419–447. - PubMed
    1. Adibi SA. The oligopeptide transporter (Pept-1) in human intestine: biology and function. Gastroenterology. 1997;113:332–340. - PubMed
    1. Liang R, et al. Human intestinal H+/peptide cotransporter. Cloning, functional expression, and chromosomal localization. J Biol Chem. 1995;270:6456–6463. - PubMed
    1. Boll M, et al. Expression cloning of a cDNA from rabbit small intestine related to proton-coupled transport of peptides, beta-lactam antibiotics and ACE-inhibitors. Pflugers Arch. 1994;429:146–149. - PubMed
    1. Fei YJ, et al. Expression cloning of a mammalian proton-coupled oligopeptide transporter. Nature. 1994;368:563–566. - PubMed

Publication types

MeSH terms