. 2001 Nov 19;194(10):1507-17.
doi: 10.1084/jem.194.10.1507.

Intercellular transfer and supramolecular organization of human leukocyte antigen C at inhibitory natural killer cell immune synapses

Affiliations

Intercellular transfer and supramolecular organization of human leukocyte antigen C at inhibitory natural killer cell immune synapses

L M Carlin et al. J Exp Med. .

Erratum in

  • J Exp Med 2001 Dec 17;194(12):1883

Abstract

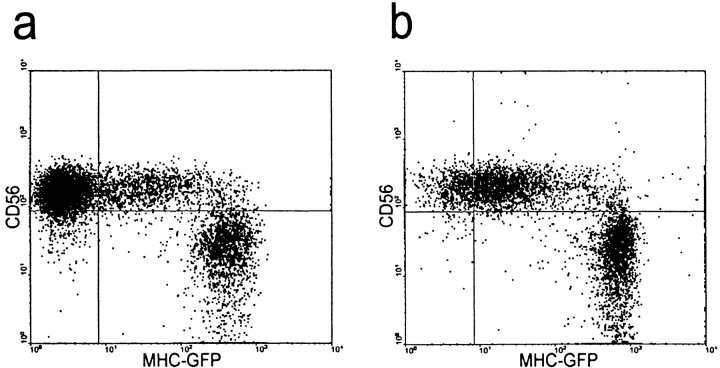
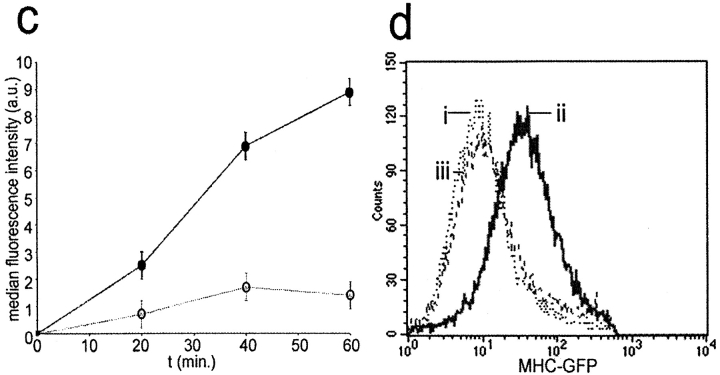
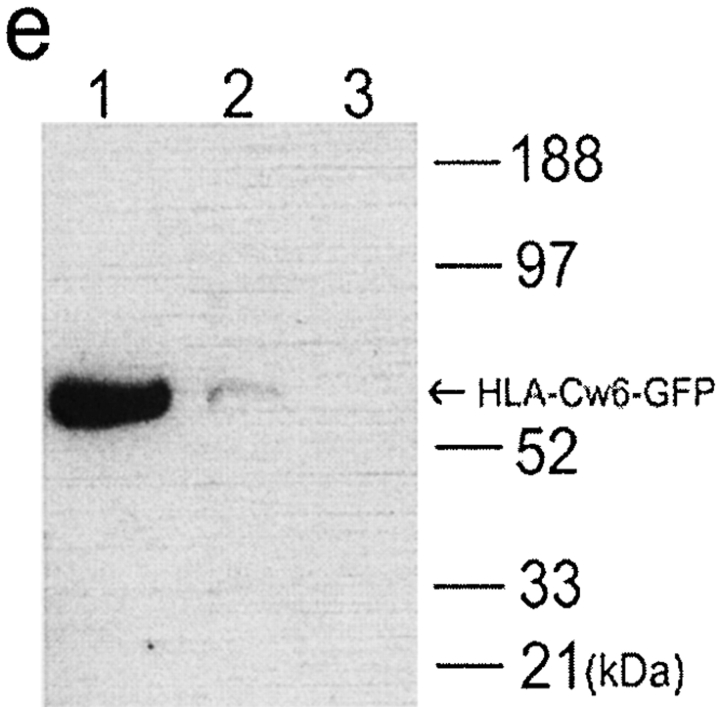
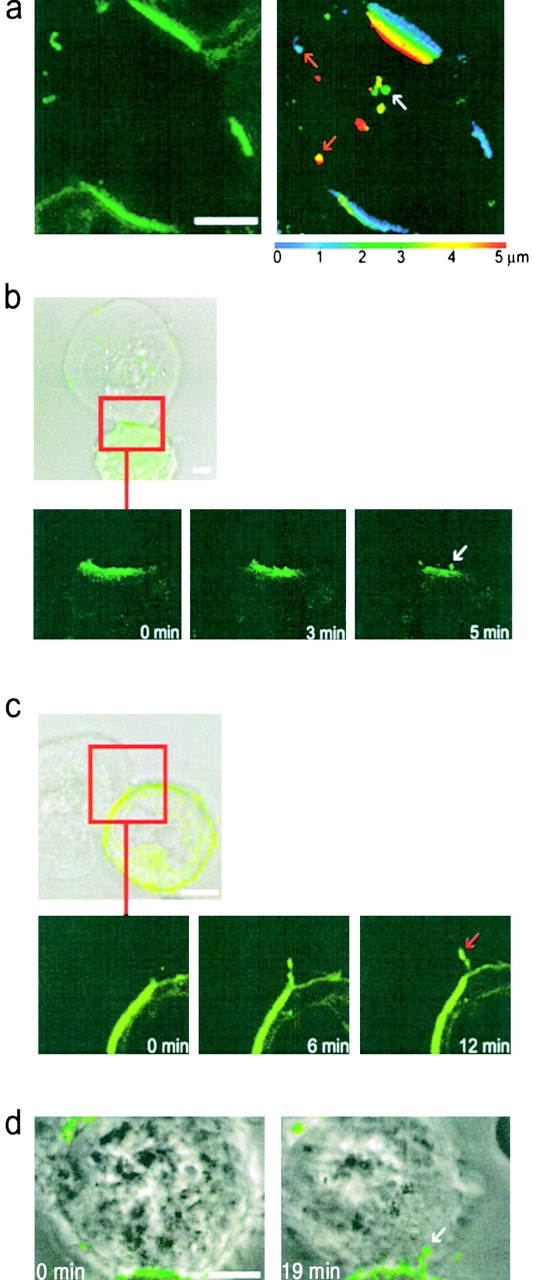
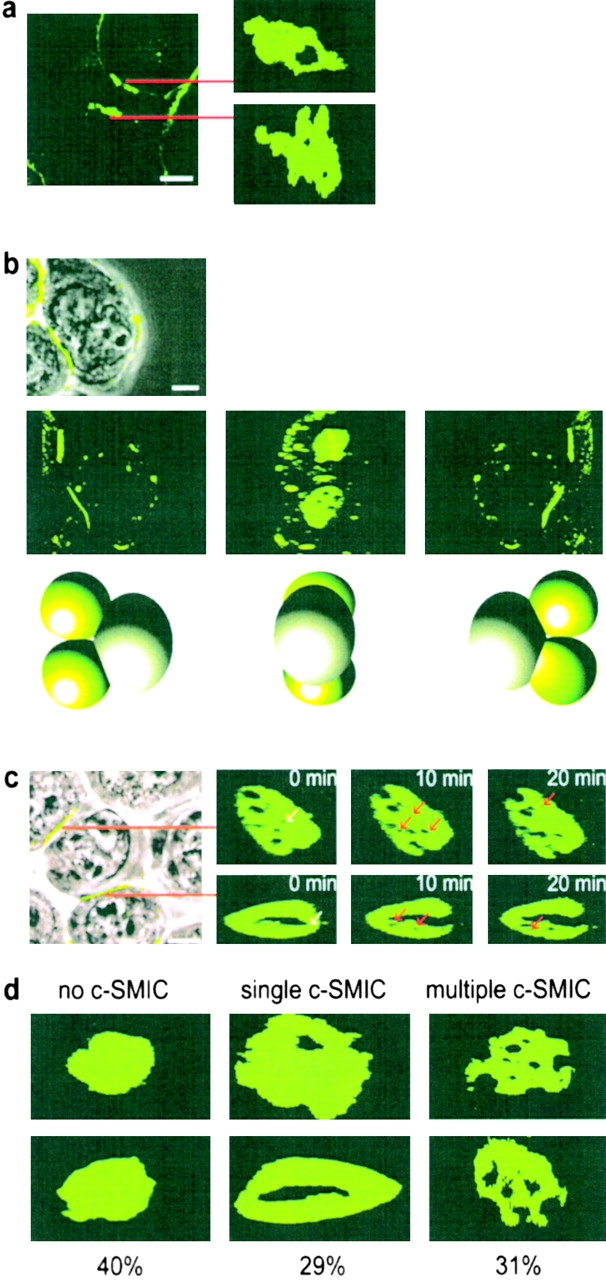
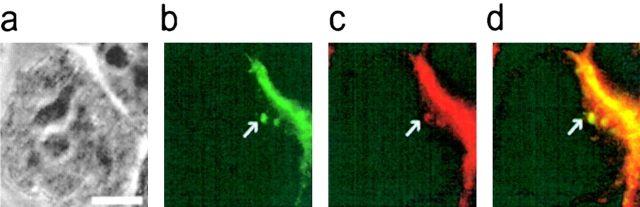
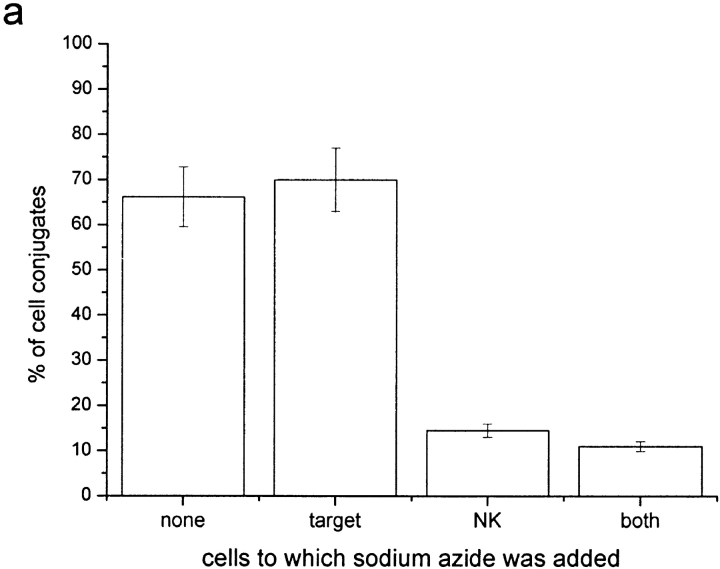
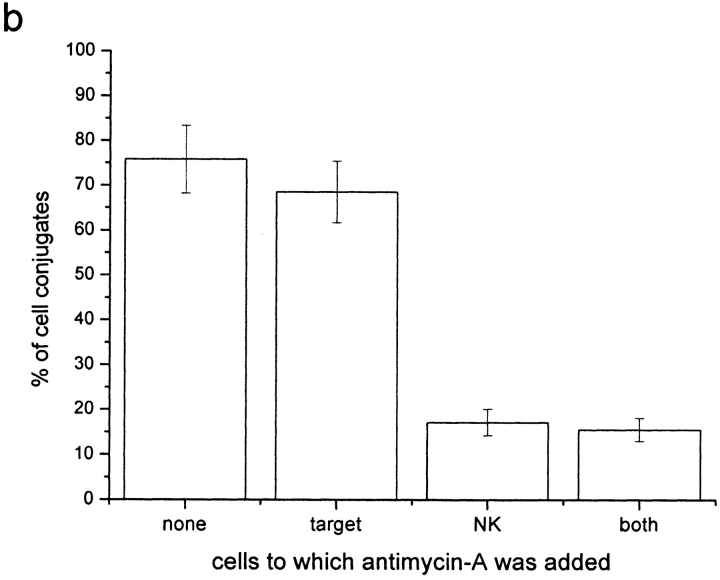
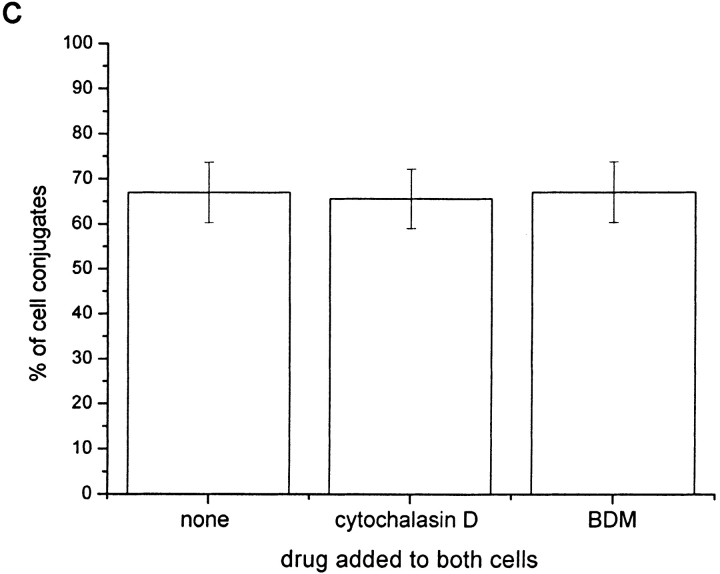
After accumulation of target cell human leukocyte antigen (HLA)-C at inhibitory natural killer (NK) cell immune synapses, some HLA-C transfers from target cells to NK cell plasma membranes and cytoplasm. This unexpected intercellular transfer of HLA-C is dependent on NK receptor recognition, since HLA-Cw6 or -Cw4 but not -Cw3 transfer to an NK transfectant expressing killer Ig-like receptor (KIR)2DL1. Strikingly, live-cell time-lapse laser scanning confocal microscopy shows vesicles containing target cell green fluorescent protein-tagged HLA-C migrating away from immune synapses into NK cells. Unlike clustering of HLA-C at the immune synapse, intercellular transfer of HLA-C is dependent on NK cell ATP, but not target cell ATP. However, the intercellular transfer of HLA-C is not dependent on active polymerization of the actin cytoskeleton. In addition, different arrangements of HLA-C are seen at inhibitory NK immune synapses, and these alter as NK synapses mature, but in a fashion distinct from that seen upon T cell activation.


Figures

Figure 2.
Figure 2.
Transfer of HLA-Cw6 transfer between populations of NK and target cells analyzed by flow cytometry. YTS/KIR2DL1 cells were incubated with either (a) 221/Cw3-GFP or (b) 221/Cw6-GFP for 1 h and subsequently fixed, stained for CD56, and analyzed by flow cytometry. Plots show level of CD56 expression (y-axis) against the level of GFP fluorescence (x-axis). CD56+ YTS/KIR2DL1 cells incubated with 221/Cw6-GFP targets have brighter GFP fluorescence compared with those incubated with 221/Cw3-GFP. (c) YTS/KIR2DL1 cells were incubated for 0, 20, 40, and 60 min with 221/Cw6-GFP or 221/Cw3-GFP targets. HLA-Cw6-GFP levels within purified YTS/KIR2DL1 populations were assessed by flow cytometry. Closed circles represent YTS/KIR2DL1 cells that were incubated with 221/Cw6-GFP targets and the open circles represent those incubated with 221/Cw3-GFP. Increasing median fluorescence intensity over time was observed in the case of YTS/KIR2DL1 cells incubated with 221/Cw6-GFP targets compared with those incubated with 221/Cw3-GFP. Data are representative of three separate experiments. (d) YTS/KIR2DL1 cells were incubated with either (i) 221/Cw3-GFP, (ii) 221/Cw6-GFP, or (iii) YTS/Eco with 221/Cw6-GFP for 1 h and subsequently fixed, stained for CD56, sorted by FACS®, and analyzed by flow cytometry. Plot shows number of cells (y-axis) against the level of GFP fluorescence (x-axis). CD56+ YTS/KIR2DL1 cells incubated with 221/Cw6-GFP targets have brighter GFP fluorescence compared with those incubated with 221/Cw3-GFP or compared with YTS/Eco incubated with 221/Cw6-GFP. (e) YTS/KIR2DL1 preincubated with both 221/Cw6-GFP and 221/Cw3-GFP were isolated by FACS®, lysed, and the total protein analyzed by SDS-PAGE followed by Western blot analysis with anti-GFP mAb. Lane 1 contains 221/Cw6-GFP cell lysate to indicate the size of HLA-Cw6-GFP. Lanes 2 and 3 are YTS/KIR2DL1 preincubated with 221/Cw6-GFP and 221/Cw3-GFP, respectively. Blot shown is representative of three independent experiments.
Figure 2.
Figure 2.
Transfer of HLA-Cw6 transfer between populations of NK and target cells analyzed by flow cytometry. YTS/KIR2DL1 cells were incubated with either (a) 221/Cw3-GFP or (b) 221/Cw6-GFP for 1 h and subsequently fixed, stained for CD56, and analyzed by flow cytometry. Plots show level of CD56 expression (y-axis) against the level of GFP fluorescence (x-axis). CD56+ YTS/KIR2DL1 cells incubated with 221/Cw6-GFP targets have brighter GFP fluorescence compared with those incubated with 221/Cw3-GFP. (c) YTS/KIR2DL1 cells were incubated for 0, 20, 40, and 60 min with 221/Cw6-GFP or 221/Cw3-GFP targets. HLA-Cw6-GFP levels within purified YTS/KIR2DL1 populations were assessed by flow cytometry. Closed circles represent YTS/KIR2DL1 cells that were incubated with 221/Cw6-GFP targets and the open circles represent those incubated with 221/Cw3-GFP. Increasing median fluorescence intensity over time was observed in the case of YTS/KIR2DL1 cells incubated with 221/Cw6-GFP targets compared with those incubated with 221/Cw3-GFP. Data are representative of three separate experiments. (d) YTS/KIR2DL1 cells were incubated with either (i) 221/Cw3-GFP, (ii) 221/Cw6-GFP, or (iii) YTS/Eco with 221/Cw6-GFP for 1 h and subsequently fixed, stained for CD56, sorted by FACS®, and analyzed by flow cytometry. Plot shows number of cells (y-axis) against the level of GFP fluorescence (x-axis). CD56+ YTS/KIR2DL1 cells incubated with 221/Cw6-GFP targets have brighter GFP fluorescence compared with those incubated with 221/Cw3-GFP or compared with YTS/Eco incubated with 221/Cw6-GFP. (e) YTS/KIR2DL1 preincubated with both 221/Cw6-GFP and 221/Cw3-GFP were isolated by FACS®, lysed, and the total protein analyzed by SDS-PAGE followed by Western blot analysis with anti-GFP mAb. Lane 1 contains 221/Cw6-GFP cell lysate to indicate the size of HLA-Cw6-GFP. Lanes 2 and 3 are YTS/KIR2DL1 preincubated with 221/Cw6-GFP and 221/Cw3-GFP, respectively. Blot shown is representative of three independent experiments.
Figure 1.
Figure 1.
HLA-Cw6-GFP transfers from target cells to NK cells at the inhibitory NK immune synapse. (a) A single 221/Cw6-GFP cell is seen interacting with two peripheral blood NK cells (NK line K010) demonstrating selective clustering and intercellular transfer of HLA-Cw6-GFP at the immune synapse. Figure shows the transmitted light overlaid with GFP fluorescence (left) and the corresponding GFP fluorescence only (right). Clustering of HLA-Cw6-GFP at the immune synapse and transferred vesicles of GFP are evident in the lower K010 NK cell only. (b) Vesicles containing HLA-Cw6-GFP, transferred from the target cell to the NK cell, are present on the NK cell surface and cytoplasm. Left panel shows a single 0.9 μm optical slice of GFP fluorescence in a K010 NK cell conjugated to a 221/Cw6-GFP target cell (bottom of the panel). HLA-Cw6-GFP is clustered at the immune synapse and there is also transfer of HLA-Cw6-GFP onto the NK cell surface. Images were taken every 0.3 μm through the cell perpendicular to the immune synapse and a composite of these images was then color coded for depth through the NK cell (right). The color scale used is below the panel; 0 μm (blue) represents the upper surface and 3.5 μm (red) the lower surface of the NK cell. Red and white arrows indicate vesicles containing HLA-Cw6-GFP on the plasma membrane and in the cytoplasm of the NK cell, respectively. (c) Top panel shows the transmitted light image overlaid with GFP fluorescence; lower three frames depict identical fields of view at different times, showing a vesicle containing HLA-Cw6-GFP moving away from the immune synapse into the NK cell. The white arrow indicates the position of the vesicle in the first frame. In all images, white scale bars represent 5 μm. Cells shown are representative of numerous cells in at least three independent experiments.
Figure 3.
Figure 3.
HLA-C transfers from target cells to YTS/KIR2DL1 cells at the inhibitory NK immune synapse. (a) The left panel shows the GFP fluorescence of a single YTS/KIR2DL1 cell (center) conjugated to three 221/Cw6-GFP cells (top, bottom, and right), with GFP clustered at each immune synapse. As in Fig. 1 b, images were taken every 0.3 mm through the cell perpendicular to the immune synapse and a composite of these images was then color coded for depth through the YTS/KIR2DL1 cell (right). The color scale used is below the panel; 0 μm (blue) represents the upper surface and 5 μm (red) the lower surface of the YTS/KIR2DL1 cell. Red and white arrows point out vesicles containing HLA-Cw6-GFP on the plasma membrane and in the cytoplasm of the cell respectively. (b and c) Images of a single YTS/KIR2DL1 cell conjugated with 221/Cw6-GFP cells. Top panel shows the transmitted light image overlaid with GFP fluorescence; lower frames depict the field of view highlighted in red at three different times. These show a vesicle containing HLA-Cw6-GFP moving away from the immune synapse and into the NK cell. (b) The white arrow indicates the position of a vesicle containing HLA-Cw6-GFP. (c) The red arrow indicates the position of HLA-Cw6-GFP at the edge of the immune synapse. (d) Two images of a conjugate between YTS/KIR2DL1 and 221/Cw6-GFP taken at 0 and 19 min at 37°C. The white arrow points to a vesicle containing HLA-Cw6-GFP migrating from the 221/Cw6-GFP cell into the YTS/KIR2DL1 cell. In all images, white scale bars represent 5 μm. Cells shown are representative of numerous cells in at least five independent experiments.
Figure 6.
Figure 6.
Supramolecular organization of HLA-C at inhibitory NK immune synapses. (a) Image of 221/Cw6-GFP cells surrounding a peripheral blood K010 NK cell (left) and the supramolecular organization of HLA-Cw6-GFP at the two immune synapses formed (right panels). (b) First panel shows an overlay of HLA-Cw6-GFP fluorescence and the transmitted light image of a single YTS/KIR2DL1 cell conjugated with two 221/Cw6-GFP cells (far left of frame). The next three frames depict a 3D reconstruction of the same cells, demonstrating the formation of two distinct supramolecular organizations by a single YTS/KIR2DL1 cell. Cartoons below each frame represent the orientation of the interacting cells in each frame, with green spheres representing the 221/Cw6-GFP cells. (c) Left panel shows the transmitted light image overlaid with GFP fluorescence of 221/Cw6-GFP cells surrounding a YTS/KIR2DL1 cell. The right panels show the dynamic supramolecular organization of GFP fluorescence at the two immune synapses indicated. White arrows indicate SMIC that disappear in the next frame; red arrows indicate new SMIC that were absent from the previous frame. In all images, white scale bars represent 5 μm. Cells shown are representative of numerous cells in at least three independent experiments. d shows the frequency of different patterns of p- and c-SMIC at the immune synapse between YTS/KIR2DL1 and 221/Cw6-GFP. Two images of each type of organization, i.e., no c-SMIC, single c-SMIC, and multiple c-SMIC are shown with the percentage that each was observed given below. A total of 73 synapses were analyzed over at least three independent experiments.
Figure 4.
Figure 4.
Target cell GFP transferred into YTS/KIR2DL1 colocalizes with MHC class I protein. YTS/KIR2DL1 and 221/Cw6-GFP cell conjugates were fixed, stained with HC10, a pan-class I MHC mAb, and visualized with an Alexa-568® conjugated goat anti–mouse Ig (GAM; Molecular Probes). (a) Transmitted light of a single YTS/KIR2DL1 cell (center) conjugated to a single 221/Cw6-GFP cell (in top right of panel). b and c show the (green) GFP and (red) HC10/Alexa-568® GAM fluorescence in same field of view. (d) Overlay of the GFP (green) and HC10/Alexa-568® GAM (red). Pixels at which HC10 (red) colocalizes with GFP (green) are colored yellow. The white arrow indicates two vesicles containing HC10 and GFP in the YTS/KIR2DL1 cell. White scale bar represents 5 μm.
Figure 5.
Figure 5.
Intercellular transfer of HLA-C can be inhibited by depleting NK cell ATP but not by depleting target cell ATP or by impairing both cells' actin cytoskeleton. Plot shows percentage of cell conjugates exhibiting intercellular transfer of HLA-Cw6-GFP as a percentage of those where clustering of HLA-Cw6-GFP was observed at the immune synapse. Cells were incubated with or without the following drugs as labeled (a) 50 mM sodium azide, (b) 13 μM antimycin-A, (c) 10 μM cytochalasin D, or 20 mM BDM. Each plot is representative of >100 conjugates over three independent experiments.
Figure 5.
Figure 5.
Intercellular transfer of HLA-C can be inhibited by depleting NK cell ATP but not by depleting target cell ATP or by impairing both cells' actin cytoskeleton. Plot shows percentage of cell conjugates exhibiting intercellular transfer of HLA-Cw6-GFP as a percentage of those where clustering of HLA-Cw6-GFP was observed at the immune synapse. Cells were incubated with or without the following drugs as labeled (a) 50 mM sodium azide, (b) 13 μM antimycin-A, (c) 10 μM cytochalasin D, or 20 mM BDM. Each plot is representative of >100 conjugates over three independent experiments.

References

    1. Trinchieri, G. 1989. Biology of natural killer cells. Adv. Immunol. 47:187–376. - PMC - PubMed
    1. Ljunggren, H.G., and K. Karre. 1990. In search of the ‘missing self’: MHC molecules and NK cell recognition. Immunol. Today. 11:237–244. - PubMed
    1. Lanier, L.L. 1998. NK cell receptors. Annu. Rev. Immunol. 16:359–393. - PubMed
    1. Long, E.O. 1999. Regulation of immune responses through inhibitory receptors. Annu. Rev. Immunol. 17:875–904. - PubMed
    1. Long, E.O., and S. Rajagopalan. 2000. HLA class I recognition by killer cell Ig-like receptors. Semin. Immunol. 12:101–108. - PubMed

Publication types