. 2001 Nov 19;194(10):1519-30.
doi: 10.1084/jem.194.10.1519.

Acquisition of external major histocompatibility complex class I molecules by natural killer cells expressing inhibitory Ly49 receptors

Affiliations

Acquisition of external major histocompatibility complex class I molecules by natural killer cells expressing inhibitory Ly49 receptors

A Sjöström et al. J Exp Med. .

Erratum in

  • J Exp Med 2001 Dec 17;194(12):1885

Abstract

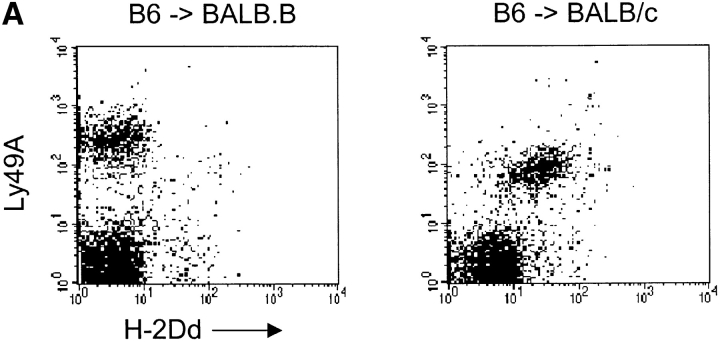
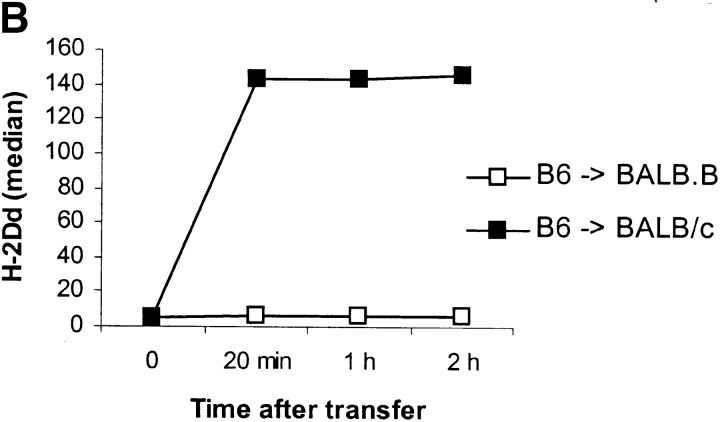
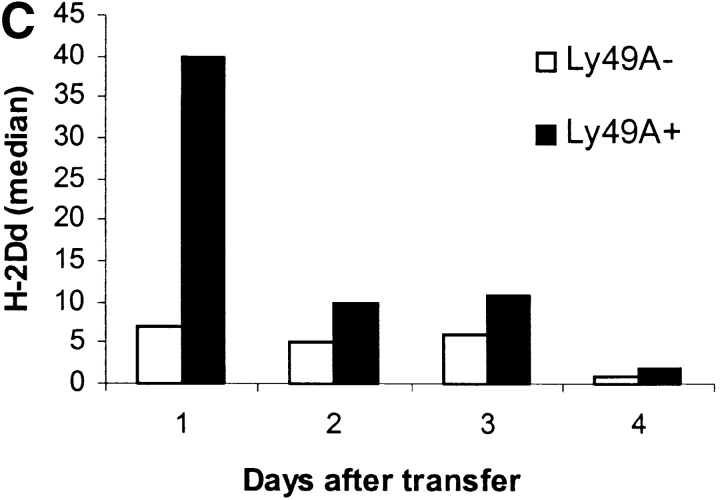
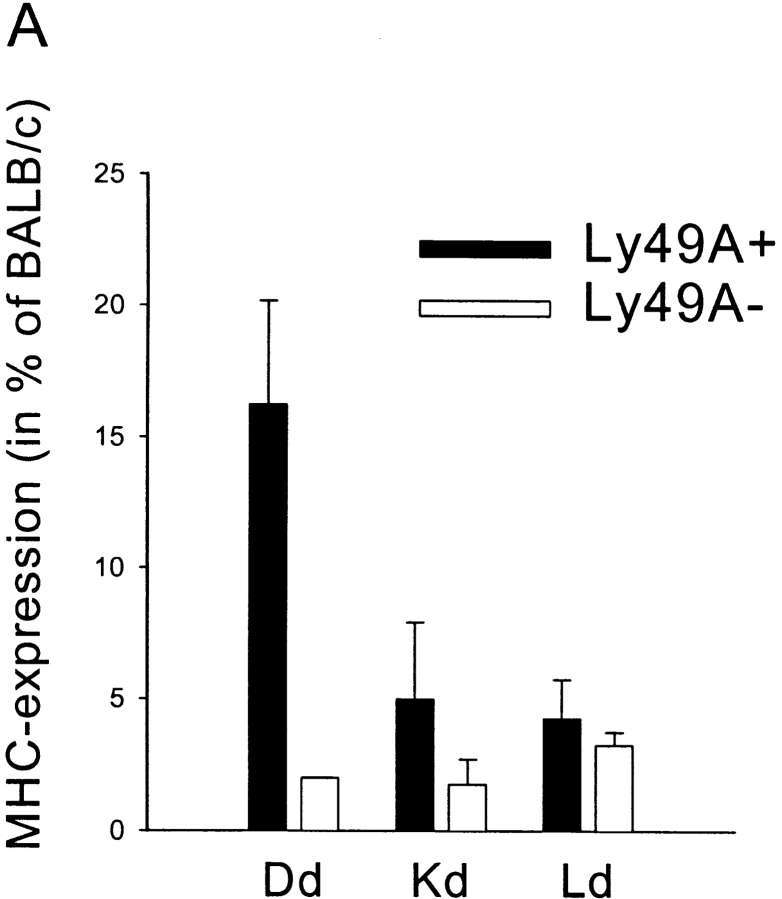
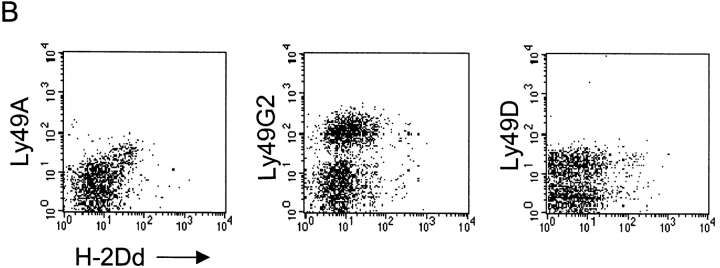
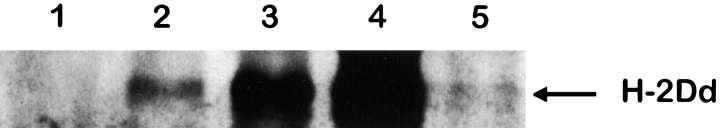
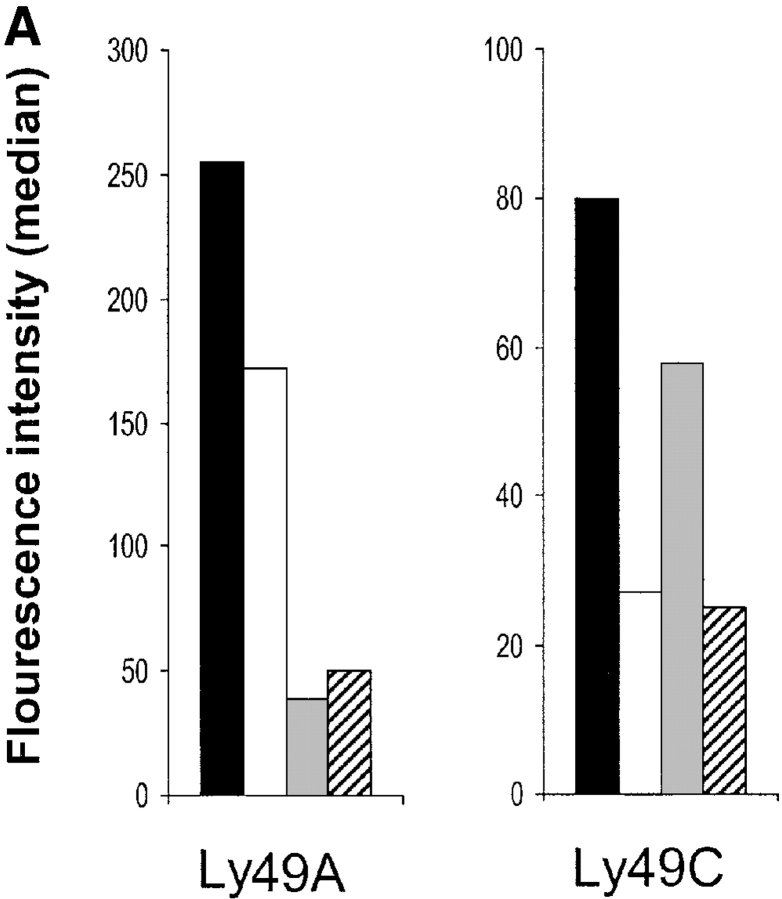
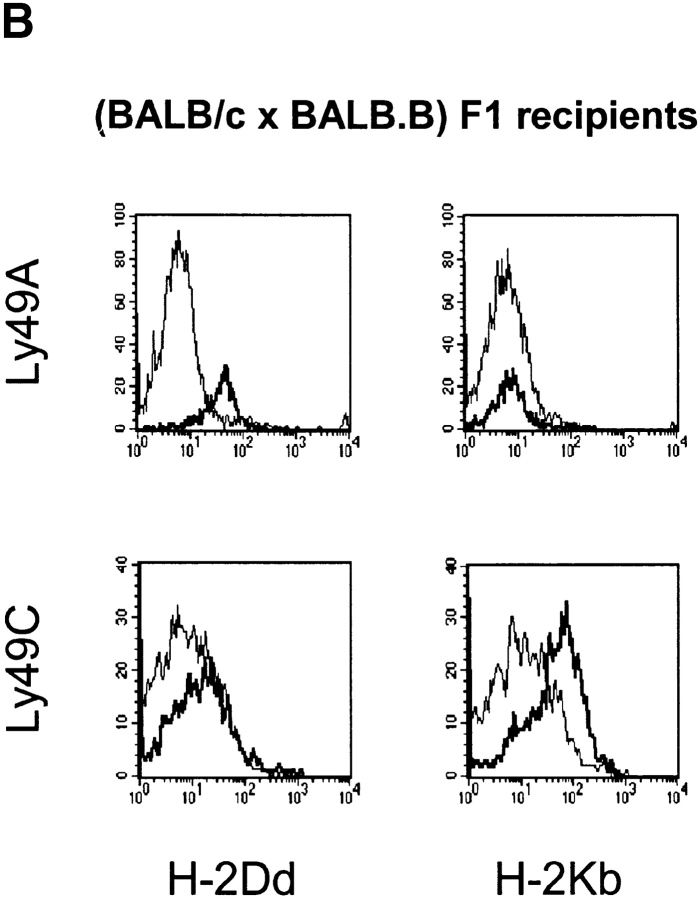
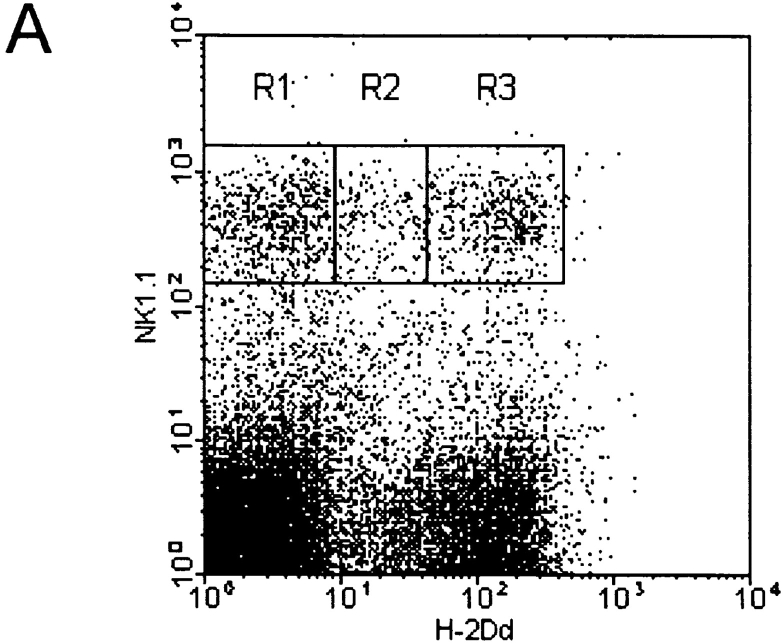
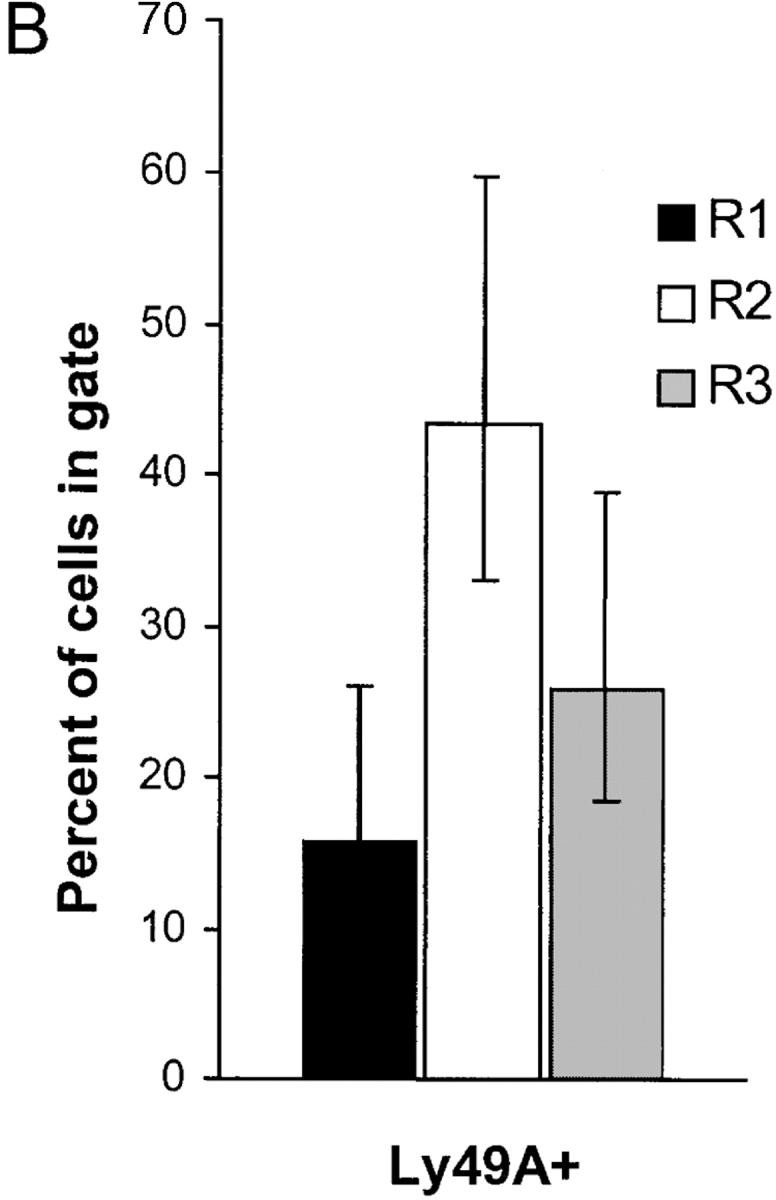
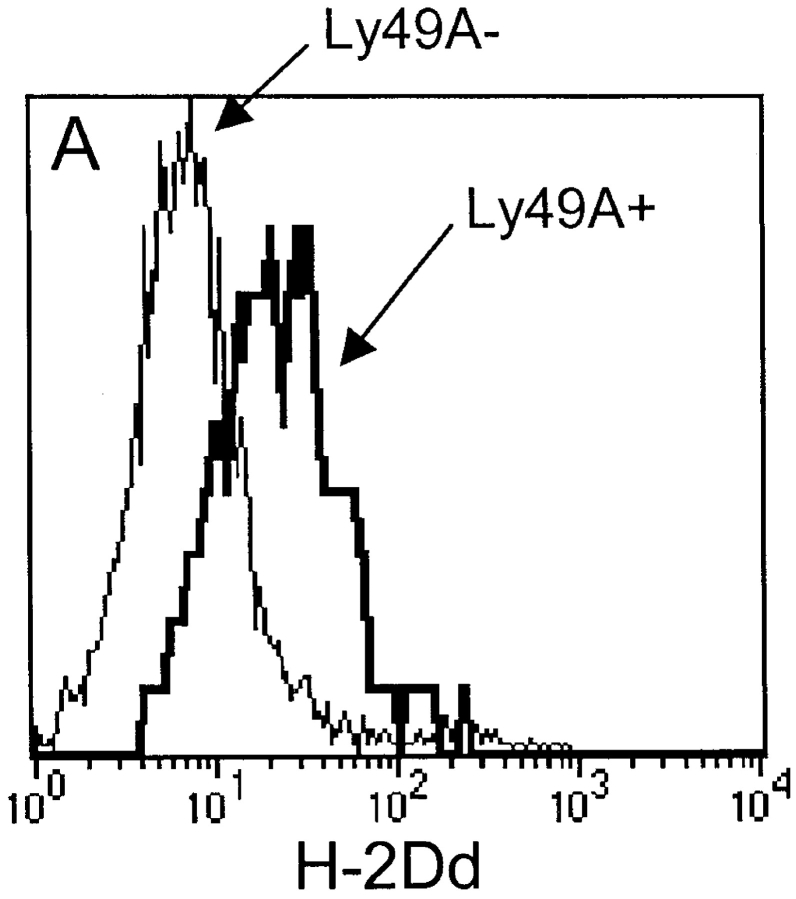
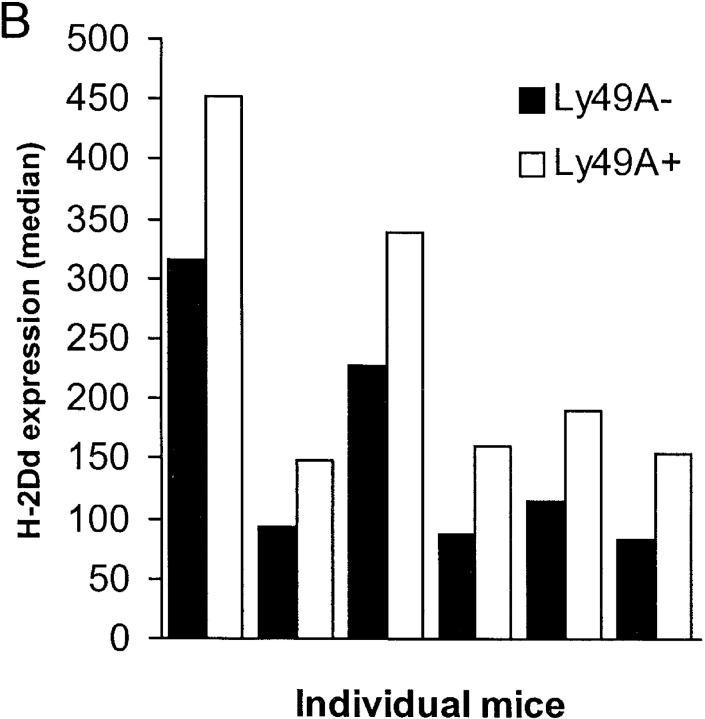
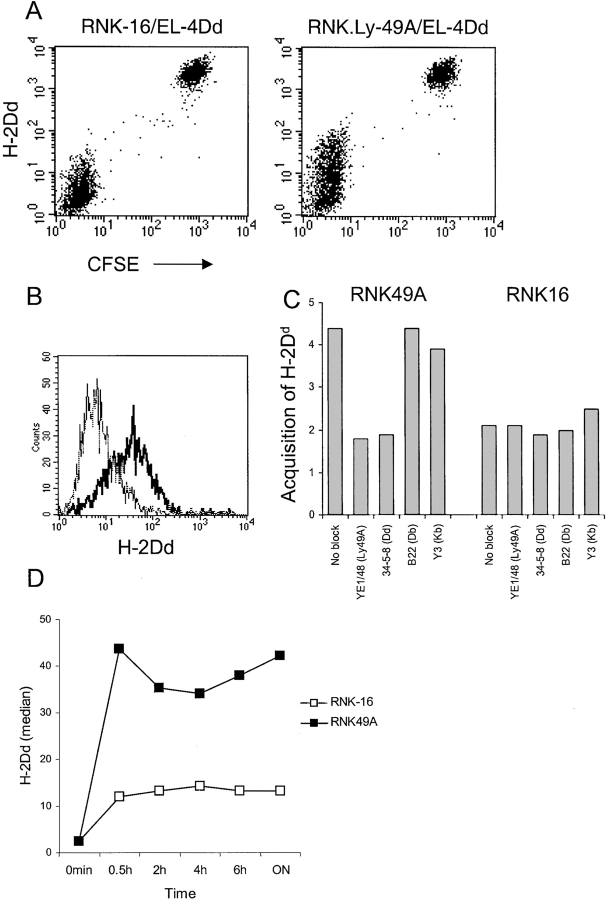
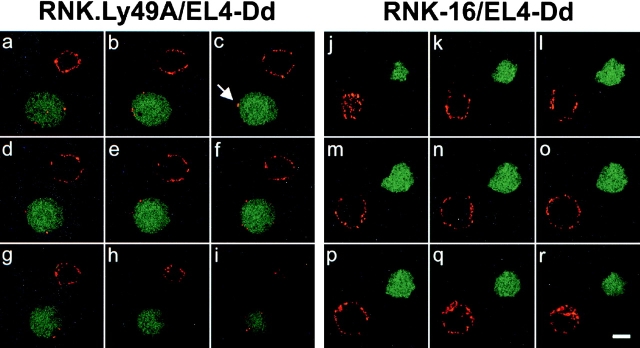
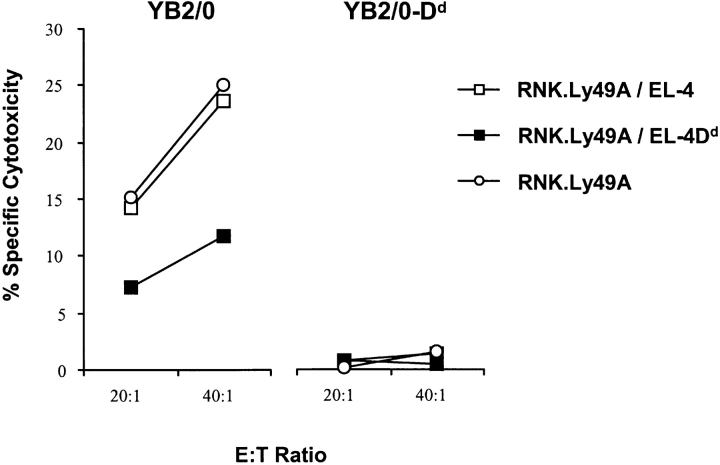
Murine natural killer (NK) cells express inhibitory Ly49 receptors specific for major histocompatibility complex (MHC) class I molecules. We report that during interactions with cells in the environment, NK cells acquired MHC class I ligands from surrounding cells in a Ly49-specific fashion and displayed them at the cell surface. Ligand acquisition sometimes reached 20% of the MHC class I expression on surrounding cells, involved transfer of the entire MHC class I protein to the NK cell, and was independent of whether or not the NK cell expressed the MHC class I ligand itself. We also present indirect evidence for spontaneous MHC class I acquisition in vivo, as well as describe an in vitro coculture system with transfected cells in which the same phenomenon occurred. Functional studies in the latter model showed that uptake of H-2D(d) by Ly49A+ NK cells was accompanied by a partial inactivation of cytotoxic activity in the NK cell, as tested against H-2D(d)-negative target cells. In addition, ligand acquisition did not abrogate the ability of Ly49A+ NK cells to receive inhibitory signals from external H-2D(d) molecules. This study is the first to describe ligand acquisition by NK cells, which parallels recently described phenomena in T and B cells.


Figures

Figure 1.
Figure 1.
(A) Ly49A+ cells acquire H-2Dd after transfer into BALB/c mice. 20–50 × 106 NWNA splenocytes were inoculated into BALB.B and BALB/c, respectively. After 16–18 h, spleens were recovered and NK1.1+ cells were analyzed for their expression of Ly49A and H-2Dd. The density plots show cells gated on the NK1.1+ population. The figure shows one representative experiment out of 45. (B) H-2Dd is acquired at high levels 20 min after transfer of B6 cells into BALB/c. Spleens were recovered after transfer at indicated time points and H-2Dd expression on NK1.1+Ly49A+ B6 cells after transfer to BALB/c and BALB.B is shown. (C) Ly49A+ NK1.1+ cells lose H-2Dd expression after one night in culture. B6 cells were transferred into BALB/c mice and spleens were recovered after 18 h. Cells were cultured in rIL-2 and analyzed for H-2Dd expression at indicated time points.
Figure 1.
Figure 1.
(A) Ly49A+ cells acquire H-2Dd after transfer into BALB/c mice. 20–50 × 106 NWNA splenocytes were inoculated into BALB.B and BALB/c, respectively. After 16–18 h, spleens were recovered and NK1.1+ cells were analyzed for their expression of Ly49A and H-2Dd. The density plots show cells gated on the NK1.1+ population. The figure shows one representative experiment out of 45. (B) H-2Dd is acquired at high levels 20 min after transfer of B6 cells into BALB/c. Spleens were recovered after transfer at indicated time points and H-2Dd expression on NK1.1+Ly49A+ B6 cells after transfer to BALB/c and BALB.B is shown. (C) Ly49A+ NK1.1+ cells lose H-2Dd expression after one night in culture. B6 cells were transferred into BALB/c mice and spleens were recovered after 18 h. Cells were cultured in rIL-2 and analyzed for H-2Dd expression at indicated time points.
Figure 2.
Figure 2.
(A) Expression of H-2Dd, H-2Kd, and H-2Ld on NK1.1+ B6 cells after transfer to BALB/c mice. MHC class I expression is indicated as percentage of the respective MHC class I expression in BALB/c (100%). Each bar represent the mean value from four individual mice from two experiments and SDs are indicated as bars. Paired Student's t tests were used to compare the relative fluorescence intensities between Ly49A+ and Ly49A cell populations after they had been normalized against BALB/c. P < 0.01 for H-2Dd, P < 0.05 for H-2Kd, and nonsignificant results for H-2Ld. (B) Comparison of H-2Dd acquisition among three different H-2Dd–binding Ly49 receptors. Density plots showing H-2Dd expression on Ly49A, G2, and D populations after B6->BALB/c transfer. All cells are gated on NK1.1.
Figure 2.
Figure 2.
(A) Expression of H-2Dd, H-2Kd, and H-2Ld on NK1.1+ B6 cells after transfer to BALB/c mice. MHC class I expression is indicated as percentage of the respective MHC class I expression in BALB/c (100%). Each bar represent the mean value from four individual mice from two experiments and SDs are indicated as bars. Paired Student's t tests were used to compare the relative fluorescence intensities between Ly49A+ and Ly49A cell populations after they had been normalized against BALB/c. P < 0.01 for H-2Dd, P < 0.05 for H-2Kd, and nonsignificant results for H-2Ld. (B) Comparison of H-2Dd acquisition among three different H-2Dd–binding Ly49 receptors. Density plots showing H-2Dd expression on Ly49A, G2, and D populations after B6->BALB/c transfer. All cells are gated on NK1.1.
Figure 3.
Figure 3.
Western blot analysis showing the H-2Dd protein from sorted B6VA49A cells after transfer to BALB/c. CFSE-labeled B6VA49A cells were transferred into BALB/c and sorted on a FACSVantage™. Immunoprecipitation with an anti–H-2Dd mAb was performed followed by Western blot analysis. 1, 1.5 × 10⁶ untransferred B6VA49A cells; 2, 1.5 × 10⁶ sorted B6VA49A cells after transfer to BALB/c; 3, 1.5 × 10⁶ BALB/c cells; 4, 5.0 × 10⁶ BALB/c cells; 5, mixture of 98% B6VA49A cells and 2% BALB/c cells (1.5 × 10⁶ cells in total). The figure shows one experiment out of four.
Figure 4.
Figure 4.
(A). Downregulation of Ly49A and Ly49C on TAP12m NK cells transferred to BALB/c, BALB.B, and (BALB/c × BALB.B)F1 recipients. Black bars show median fluorescence intensity before transfer, white bars after transfer to BALB.b, gray bars after transfer to BALB/c and hatched bars after transfer to (BALB/c × BALB.B)F1. (B) TAP12m/Ly49A+ cells acquire H-2Dd but not H-2Kb after transfer of NK cells to (BALB/c × BALB.B)F1 mice. In the same transfer, Ly49C+ NK cells acquire H-2Kb and some H-2Dd. Histograms show H-2Dd and H-2Kb expression on Ly49A+ (bold lines) and Ly49A (thin lines) cells, and on Ly49C+ (bold lines) and Ly49C (thin lines). All cells are gated on NK1.1. The figure shows one experiment out of four.
Figure 4.
Figure 4.
(A). Downregulation of Ly49A and Ly49C on TAP12m NK cells transferred to BALB/c, BALB.B, and (BALB/c × BALB.B)F1 recipients. Black bars show median fluorescence intensity before transfer, white bars after transfer to BALB.b, gray bars after transfer to BALB/c and hatched bars after transfer to (BALB/c × BALB.B)F1. (B) TAP12m/Ly49A+ cells acquire H-2Dd but not H-2Kb after transfer of NK cells to (BALB/c × BALB.B)F1 mice. In the same transfer, Ly49C+ NK cells acquire H-2Kb and some H-2Dd. Histograms show H-2Dd and H-2Kb expression on Ly49A+ (bold lines) and Ly49A (thin lines) cells, and on Ly49C+ (bold lines) and Ly49C (thin lines). All cells are gated on NK1.1. The figure shows one experiment out of four.
Figure 5.
Figure 5.
(A) Staining of mosaic DL6 mice with NK1.1 and H-2Dd reveals three populations with different H-2Dd levels; a low (R1), intermediate (R2), and a high (R3) population. (B) Percentage of Ly49A+ cells among NK1.1+ cells in the three populations. The graph shows a summary of 16 consecutive experiments including 16 individual mice. Error bars show SD. Paired Student's t tests were used to compare the amount of Ly49A-positive cells in the intermediate population R2 compared with the negative population R1 (P < 0.001) and between the intermediate population R2 compared with the positive population R3 (P < 0.001).
Figure 5.
Figure 5.
(A) Staining of mosaic DL6 mice with NK1.1 and H-2Dd reveals three populations with different H-2Dd levels; a low (R1), intermediate (R2), and a high (R3) population. (B) Percentage of Ly49A+ cells among NK1.1+ cells in the three populations. The graph shows a summary of 16 consecutive experiments including 16 individual mice. Error bars show SD. Paired Student's t tests were used to compare the amount of Ly49A-positive cells in the intermediate population R2 compared with the negative population R1 (P < 0.001) and between the intermediate population R2 compared with the positive population R3 (P < 0.001).
Figure 6.
Figure 6.
(A) Acquisition of H-2Dd by DL1 NK cells after transfer to BALB/c mice. Histogram overlays show H-2Dd expression on Ly49A+ (bold line) and Ly49A (thin line) DL1 cells after transfer to BALB/c. H-2Dd expression on DL1 cells is measured with a mAb recognizing α3 of H-2Dd in order to distinguish H-2Dd derived from BALB/c since DL1 cells express a chimeric H-2Dd molecule containing α3 from H-2Ld. (B) H-2Dd expression on Ly49A+ and Ly49A NK cells from H-2Dd transgenic D8 mice. The figure shows six individual mice. In both A and B, cells gated on NK1.1+ cells.
Figure 6.
Figure 6.
(A) Acquisition of H-2Dd by DL1 NK cells after transfer to BALB/c mice. Histogram overlays show H-2Dd expression on Ly49A+ (bold line) and Ly49A (thin line) DL1 cells after transfer to BALB/c. H-2Dd expression on DL1 cells is measured with a mAb recognizing α3 of H-2Dd in order to distinguish H-2Dd derived from BALB/c since DL1 cells express a chimeric H-2Dd molecule containing α3 from H-2Ld. (B) H-2Dd expression on Ly49A+ and Ly49A NK cells from H-2Dd transgenic D8 mice. The figure shows six individual mice. In both A and B, cells gated on NK1.1+ cells.
Figure 7.
Figure 7.
(A) Acquisition of H-2Dd on RNK.Ly49A cells. EL-4Dd cells were labeled with CFSE and cocultured overnight with RNK.Ly49A or RNK-16 effector cells and analyzed by flow cytometry using anti–H-2Dd mAb plus goat anti–mouse biotin antiserum plus streptavidin-PE, as described previously. Panels show H-2Dd stainings of cell mixtures containing EL-4Dd cells cocultured with RNK-16 cells (left) or RNK.Ly49A (right), respectively. One experiment of five. (B) H-2Dd staining of RNK.Ly49A cells cultured overnight alone (dotted line), together with EL-4 (thin solid line) or together with EL-4Dd (thick solid line). (C) Relative acquisition of H-2Dd by RNK.Ly49A and RNK-16 cells after cocultures with EL-4Dd in the presence of antibodies against Ly49A or either one of the classical MHC class I molecules expressed on EL4-Dd: H-2Kb, H-2Db, and H-2Dd. Acquisition of H-2Dd by RNK.Ly49A was only prevented when antibodies against either Ly49A or H-2Dd was added to the culture. H-2Dd staining is plotted relative (fold-increase) to the staining of RNK.Ly49A or RNK-16 cells cultured alone in the same experiment. (D) Kinetics of H-2Dd uptake. Median values of H-2Dd staining on gated RNK-16 or RNK.Ly49A cells after coculture with EL-4Dd cells for various time periods. One experiment of four with similar results.
Figure 8.
Figure 8.
RNK.Ly49A cells acquire H-2Dd-molecules in a patch-like pattern on the cell surface. CFSE (green) labeled RNK.Ly49A (a-i) and RNK-16 (j-r) cells were cocultured with unlabeled EL-4Dd cells. All cells were stained with α-H-2Dd (red) mAb. The cells were analyzed on a LSCM and displayed as a series of sequential cross-sections. Each image represents one RNK and one EL-4Dd cell. Acquired H-2Dd-molecules are observed as red dots on the green RNK.Ly49A cells, as indicated by the arrow in c. Scale bar is 5 μm.
Figure 9.
Figure 9.
Reduced cytotoxic activity by sorted RNK.Ly49A cells after acquisition of H-2Dd. Lysis of 51Cr-labeled YB2/0 cells and YB2/0-Dd cells by sorted RNK.Ly49A cells cocultured overnight with EL-4 (white squares), EL-4Dd (black squares), and no cells (white circles). The figure shows one representative experiment of four.

Similar articles

Cited by

References

    1. Yokoyama, W.M. 1999. Natural Killer Cells. 4th edition. Fundamental Immunology. P. Ewe, editor. Lippincott-Raven, Philadelphia. 575–603 pp.
    1. Lanier, L.L. 1998. NK cell receptors. Annu. Rev. Immunol. 16:359–393. - PubMed
    1. Ljunggren, H.G., and K. Kärre. 1990. In search of the ‘missing self’: MHC molecules and NK cell recognition. Immunol. Today. 11:237–244. - PubMed
    1. Karlhofer, F.M., R.K. Ribaudo, and W.M. Yokoyama. 1992. MHC class I alloantigen specificity of Ly-49+ IL-2-activated natural killer cells. Nature. 358:66–70. - PubMed
    1. Grakoui, A., S.K. Bromley, C. Sumen, M.M. Davis, A.S. Shaw, P.M. Allen, and M.L. Dustin. 1999. The immunological synapse: a molecular machine controlling T cell activation. Science. 285:221–227. - PubMed

Publication types