. 2001 Dec;10(12):2426-38.
doi: 10.1110/ps.18201.

Structure and dynamics of translation initiation factor aIF-1A from the archaeon Methanococcus jannaschii determined by NMR spectroscopy

Affiliations

Structure and dynamics of translation initiation factor aIF-1A from the archaeon Methanococcus jannaschii determined by NMR spectroscopy

W Li et al. Protein Sci. 2001 Dec.

Abstract

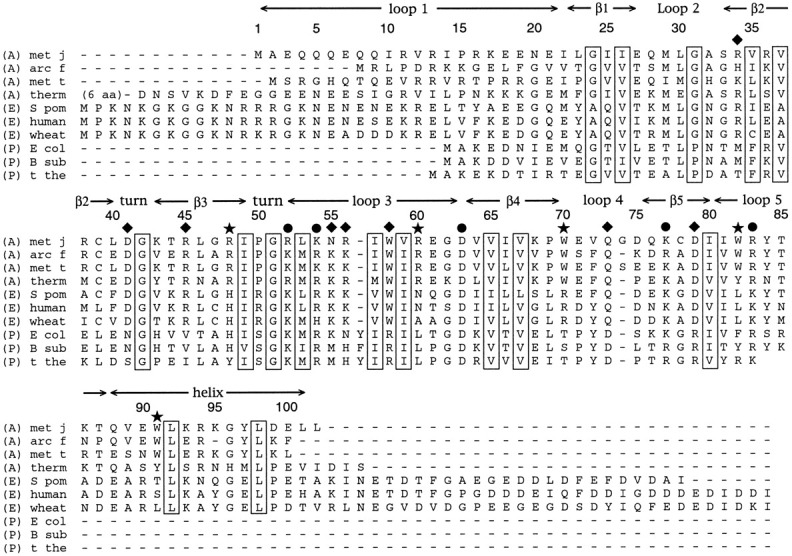
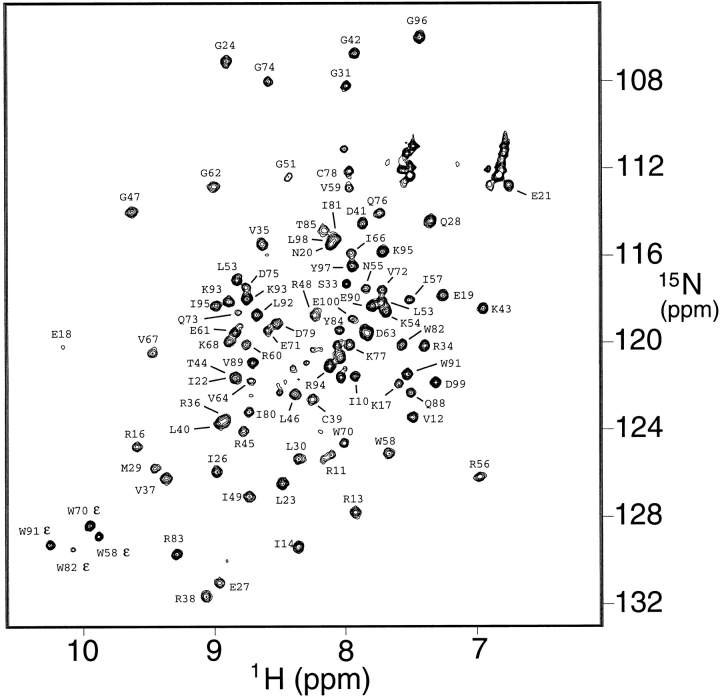
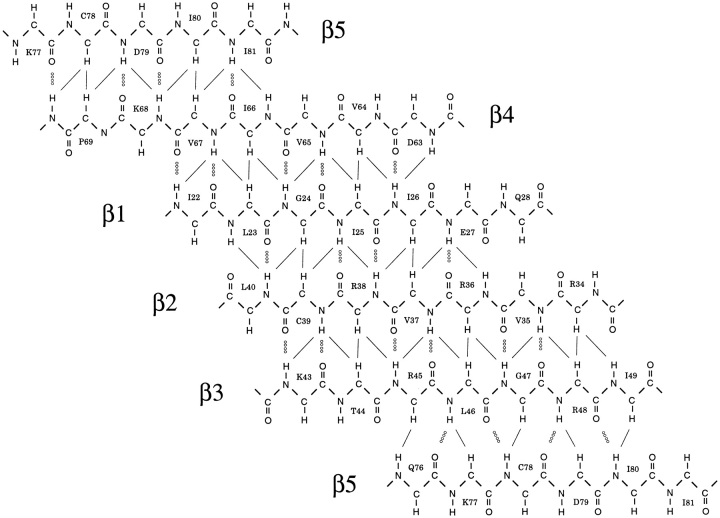
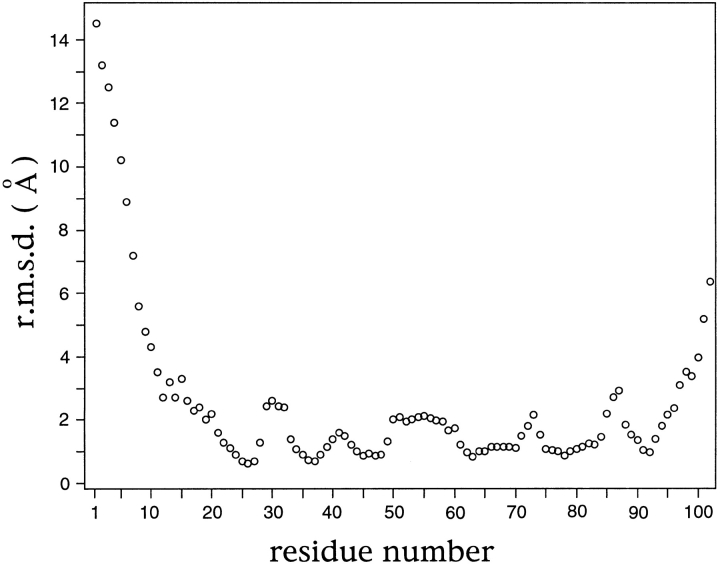
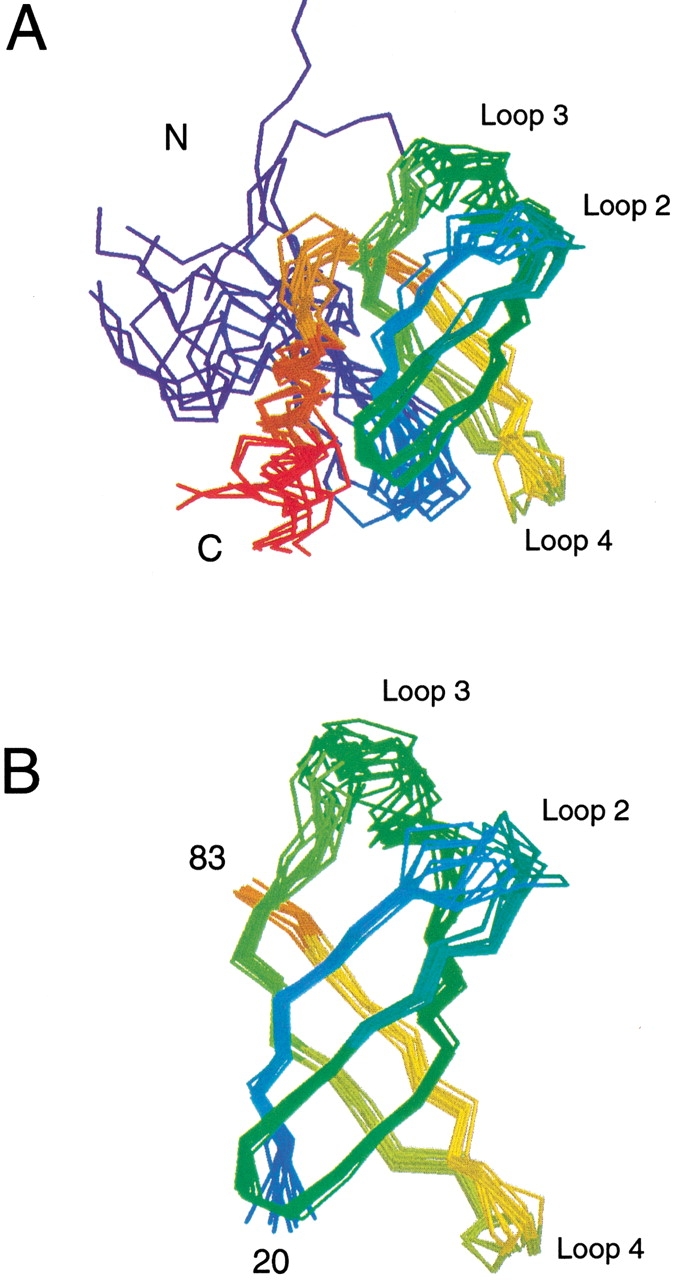
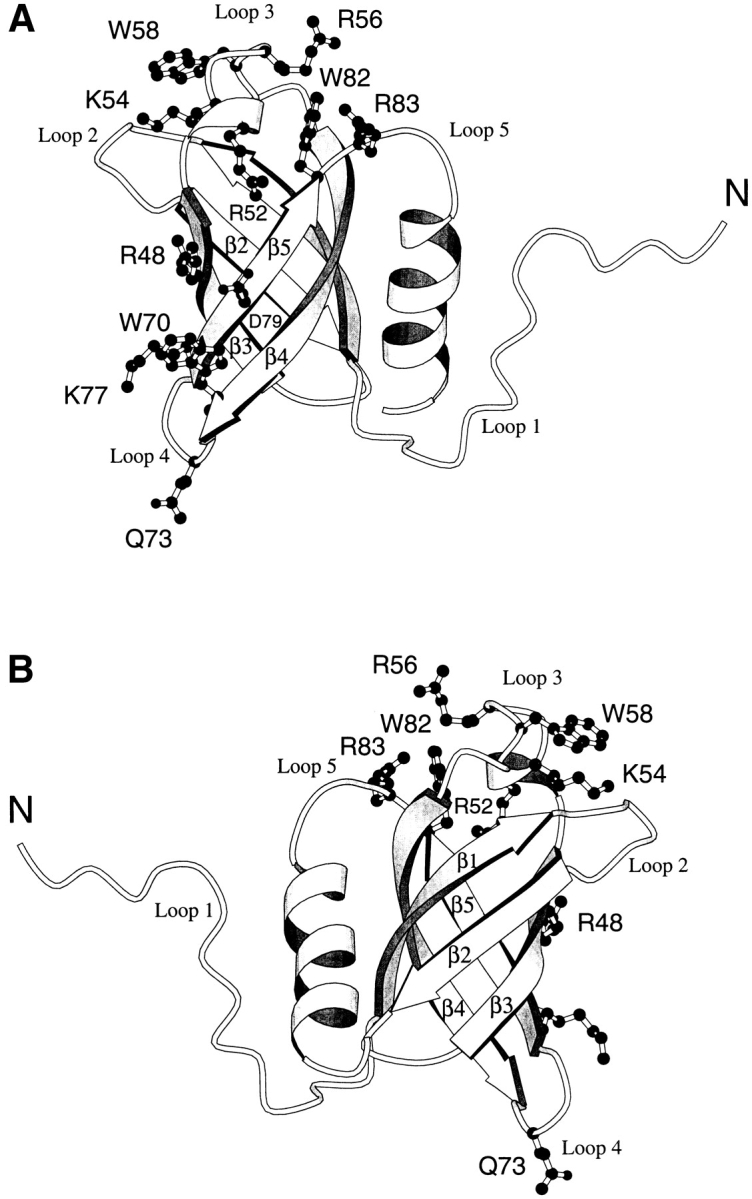
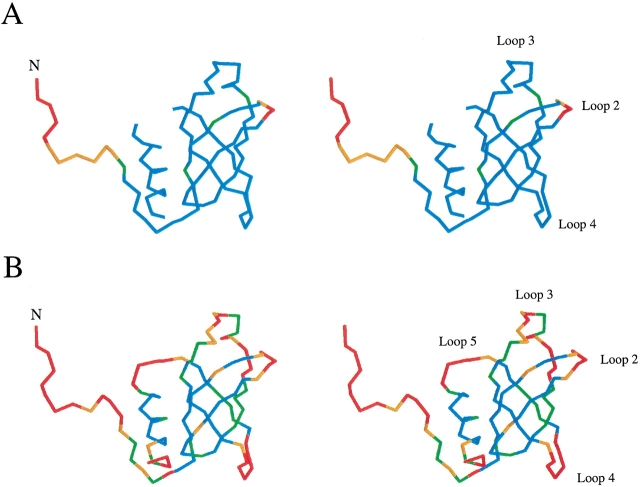
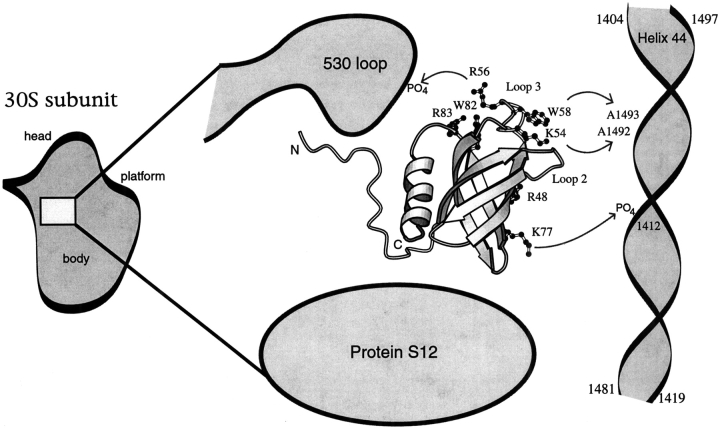
Translation initiation factor 1A (aIF-1A) from the archaeon Methanococcus jannaschii was expressed in Escherichia coli, purified, and characterized in terms of its structure and dynamics using multidimensional NMR methods. The protein was found to be a member of the OB-fold family of RNA-associated proteins, containing a barrel of five beta-strands, a feature that is shared with the homologous eukaryotic translation initiation factor 1A (eIF-1A), as well as the prokaryotic translation initiation factor IF1. External to the beta barrel, aIF-1A contains an alpha-helix at its C-terminal and a flexible loop at its N-terminal, features that are qualitatively similar to those found in eIF-1A, but not present in prokaryotic IF1. The structural model of aIF-1A, when used in combination with primary sequence information for aIF-1A in divergent species, permitted the most-conserved residues on the protein surface to be identified, including the most likely candidates for direct interaction with the 16S ribosomal RNA and other components of the translational apparatus. Several of the conserved surface residues appear to be unique to the archaea. Nitrogen-15 relaxation and amide exchange rate data were used to characterize the internal motions within aIF-1A, providing evidence that the protein surfaces that are most likely to participate in intermolecular interactions are relatively flexible. A model is proposed, suggesting some specific interactions that may occur between aIF-1A and the small subunit of the archaeal ribosome.


Figures

Fig. 1.
Fig. 1.
An alignment of the amino acid sequences of the aIF-1A protein from four species of archaea (A), eIF-1A from three species of eukaryotes (E), and IF1 from three species of prokaryotes (P), shown using the one-letter amino acid code. Representative species of archaea are Methanococcus jannaschii (met j), Archaeoglobus fulgidus (arc f), Methanobacterium thermoautotrophicum (met t), Thermoplasma acidophilum (therm), eukaryotes are Saccromyces pombe (S pom), Homo sapiens (human) and Triticum aestivum (wheat); prokaryotes are Escherichia coli (E col), Bacillus subtilis (B sub) and Thermus thermophilus (t the). Residues that are conserved for structural purposes, such as hydrophobic residues in the protein core and glycine and proline residues in turns, are boxed. Surface residues that are universally well conserved among the archaea, eukaryotes, and prokaryotes are identified by circles. Surface residues that usually have similar identities in the archaea and eukaryotes, but differ in the prokaryotes, are identified by diamonds. Surface residues that are well conserved in the archaea, with identities that are distinct from the eukaryotes and prokaryotes, are identified by stars. Although only 10 sequences are shown in the figure, a substantially larger set of sequences was compared when making the decision as to which residues are relatively well conserved.
Fig. 2.
Fig. 2.
A 15N-1H-correlated HSQC spectrum of the aIF-1A protein from M. jannaschii obtained at 35°C, using presaturation for solvent H2O suppression, so that the amide protons that exchange relatively rapidly with the solvent are attenuated. Assignments for 84 of the best-resolved cross peaks are labeled in the figure. NMR assignments were obtained for 96 of the 102 amino acids, and are summarized in Table S1 of the supplemental material.
Fig. 3.
Fig. 3.
A diagram showing the β-sheet structure within the five-stranded β-barrel of the aIF-1A protein, as derived from NMR data. Strand β5 appears twice in the figure to show its antiparallel arrangement, relative to strand β4, and parallel arrangement relative to strand β3. Pairs of protons for which interstrand NOEs are observed are indicated by thin lines, and interstrand hydrogen bonds are indicated by dotted lines.
Fig. 4.
Fig. 4.
A plot of the root mean square deviation (RMSD) for the coordinates of the backbone heavy atoms for the aIF-1A protein vs. residue number, calculated using 12 structures that satisfy the NMR-derived structural constraints, which are a fair representation of the full range of structures that are consistent with NMR data. The RMSD values were calculated using a set of 12 structures that were superimposed by minimizing the differences in the coordinates of the backbone atoms of residues 9 through 102. The figure shows that the β-barrel is quite well-defined by NMR data (RMSD ∼1 Å), and the loops connecting the strands of the β-barrel are moderately well defined (RMSD ∼2 Å), whereas the positions of the 10 residues nearest the N-terminal and the two residues nearest the C-terminal are not well determined (RMSD > 5 Å). Because all parts of the structure are not equally well determined, the RMSD statistics can vary significantly, depending on which parts of the structure are included in the calculation. If the structures are superimposed using only residues 22 to 81, the RMSD for the β-strand residues is 0.47 Å (see Fig. 5 ▶ and Table 2).
Fig. 5.
Fig. 5.
A superposition of the backbones of 12 low-energy structures of aIF-1A that are equally consistent with the NMR data, which are color-ramped from blue at the N-terminal to red at the C-terminal of the protein. The 12 models are a fair representation of the full range of structures that are consistent with the NMR-derived constraints. (A) The superposition of the 12 models is performed by minimizing the differences in the coordinates of residues 12 to 102; all 102 residues of the protein are shown. (B) The superposition of the models is performed by minimizing the differences in the coordinates of residues 20 to 83; only residues 20 to 83 are shown.
Fig. 6.
Fig. 6.
Ribbon diagrams of the protein aIF-1A, created using MOLSCRIPT (Kraulis 1991), with the relative positions of some of the most-conserved surface residues indicated. (A) Front view of the protein. (B) Back view of the protein. The conserved surface residues are concentrated in loop 3 and on the front surface of the protein, whereas the back surface of the protein is populated with unconserved hydrophilic residues. Conserved surface residues R52, K54, R56, W58, D63, and R83 are located within or near loop 3, a surface loop that connects strands β3 and β4. Residues R48, W70, K77, and D79 form a second conserved cluster on the protein surface. The helix at the C-terminal of the protein covers a conserved hydrophobic patch centered at residues L23, I25, V64, and I66 on the surface of the 5-stranded β-barrel. It should be noted that NMR data do not establish the exact conformations of the side chains. Hence, the purpose of this figure is to indicate the locations of those residues that are on the protein surface, rather than to indicate precise side-chain conformations.
Fig. 7.
Fig. 7.
Ribbon diagrams of the translation initiation factors IF1, aIF-1A, and eIF-1A. The ribbon diagrams were created using MOLSCRIPT (Kraulis 1991) and using coordinates from PDB entry 1AH9 for IF1 (Sette et al. 1997) and PDB entry 1D7Q for eIF-1A (Battiste et al. 2000). The coordinates for aIF-1A have been submitted to the Protein Data Bank and have been assigned PDB code 1JT8. All 71 residues are displayed for IF1; residues 7 to 102 are displayed for aIF-1 and residues 20 to 108 are displayed for eIF-1A.
Fig. 8.
Fig. 8.
A summary of the NMR results related to internal motions within the aIF-1A protein. (A) A color-coded stereo view representation of the values of the order parameters (S2) derived from 15N relaxation rate data for the backbone amide nuclei. Residues with order parameters < 0.5 are indicated in red; residues with order parameters between 0.5 and 0.7 are indicated in orange; residues with order parameters between 0.7 and 0.8 are indicated in green; residues with order parameters > 0.8 are indicated in blue. Backbone amide nuclei with the greatest values of the order parameter generally have the most-restricted motion on the picosecond-to-nanosecond time scale. Residues 1, 84–87, 101, and 102 are not included in the figure, because their amide protons exchange too rapidly with the solvent for 15N relaxation rate data to be obtained; other residues for which no 15N relaxation rate data was obtained, such as the prolines and the isolated unassigned residues, are labeled with the color appropriate for the adjacent residues. (B) A representation of the rates, with which backbone amide protons exchange with deuterium, which are derived from NMR data. Amide protons with exchange rates > 10−1 s−1 are indicated in red; exchange rates between 10−1 and 10−2 s−1 are indicated in orange; exchange rates between 10−2 and 10−4 s−1 are green; exchange rates < 10−4 s−1 are indicated in blue. Solvent exchange rates are normalized to pH 7, assuming a 10-fold increase in exchange rate for each increase of 1 pH unit. In general, amide groups with the lowest solvent exchange rates tend to be in the least flexible and least solvent-exposed parts of the protein.
Fig. 9.
Fig. 9.
A schematic representation of where the aIF-1A protein might bind near the A-site of the archaeal ribosome small subunit. Possible RNA-protein interactions were identified by superimposing the β-barrel of the aIF-1A structure, determined in the present work, onto the β-barrel of IF1 in complex with the prokaryotic 30S ribosomal small subunit (Carter et al. 2001). Based on this superposition of structures, it is hypothesized that K54 and W58 of aIF-1A may make specific contacts with bases A1493 and A1492 of helix 44, and R56 and K77 may make specific contacts with phosphate groups on the backbone of the 530 loop and helix 44, respectively. These hypothetical interactions could potentially be confirmed by additional structural studies. It should be noted that the conformations of the side chains are not exactly established by NMR data. Hence, the purpose of this figure is to indicate conserved residues that are on the protein surface and available for binding and their locations on the protein surface, rather than to indicate precise side-chain conformations.

Similar articles

Cited by

References

    1. Ban, N., Nissen, P., Hansen, J., Moore, P.B., and Steitz, T.A. 2000. The complete atomic structure of the large ribosomal subunit at 2.4 Å resolution. Science 289 905–920. - PubMed
    1. Battiste, J.L., Pestova, T.V., Hellen, C.U., and Wagner, G. 2000. The eIF1A solution structure reveals a large RNA-binding surface important for scanning function. Mol. Cell 5 109–119. - PubMed
    1. Bell, S.D. and Jackson, S.P. 1998. Transcription and translation in Archaea: A mosaic of eukaryal and bacterial features. Trends Microbiol. 6 222–228. - PubMed
    1. Biou, V., Shu, F., and Ramakrishnan, V. 1995. X-ray crystallography shows that translational initiation factor IF3 consists of two compact alpha/beta domains linked by an alpha-helix. EMBO J. 14 4056–4064. - PMC - PubMed
    1. Brock, S., Szkaradkiewicz, K., and Sprinzl, M. 1998. Initiation factors of protein biosynthesis in bacteria and their structural relationship to the elongation and termination factors. Mol. Microbiol. 29 409–417. - PubMed

Publication types

Substances

LinkOut - more resources