

Free energies of protein decoys provide insight into determinants of protein stability
- PMID: 11714917
- PMCID: PMC2374037
- DOI: 10.1110/ps.15501
Free energies of protein decoys provide insight into determinants of protein stability
Abstract
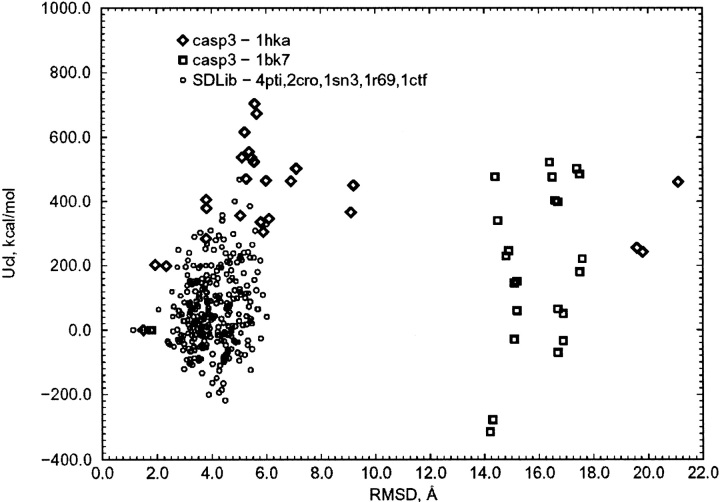
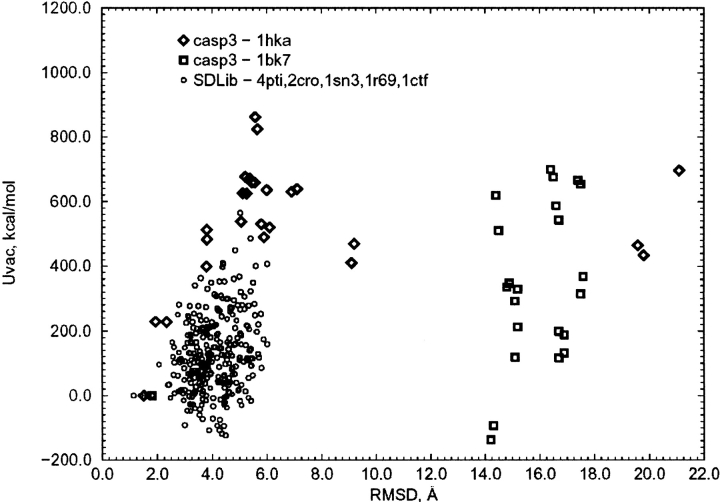
We have calculated the stability of decoy structures of several proteins (from the CASP3 models and the Park and Levitt decoy set) relative to the native structures. The calculations were performed with the force field-consistent ES/IS method, in which an implicit solvent (IS) model is used to calculate the average solvation free energy for snapshots from explicit simulations (ESs). The conformational free energy is obtained by adding the internal energy of the solute from the ESs and an entropic term estimated from the covariance positional fluctuation matrix. The set of atomic Born radii and the cavity-surface free energy coefficient used in the implicit model has been optimized to be consistent with the all-atom force field used in the ESs (cedar/gromos with simple point charge (SPC) water model). The decoys are found to have a consistently higher free energy than that of the native structure; the gap between the native structure and the best decoy varies between 10 and 15 kcal/mole, on the order of the free energy difference that typically separates the native state of a protein from the unfolded state. The correlation between the free energy and the extent to which the decoy structures differ from the native (as root mean square deviation) is very weak; hence, the free energy is not an accurate measure for ranking the structurally most native-like structures from among a set of models. Analysis of the energy components shows that stability is attained as a result of three major driving forces: (1) minimum size of the protein-water surface interface; (2) minimum total electrostatic energy, which includes solvent polarization; and (3) minimum protein packing energy. The detailed fit required to optimize the last term may underlie difficulties encountered in recovering the native fold from an approximate decoy or model structure.
Figures


Similar articles
-
ES/IS: estimation of conformational free energy by combining dynamics simulations with explicit solvent with an implicit solvent continuum model.Biophys Chem. 1999 Apr 5;78(1-2):195-205. doi: 10.1016/s0301-4622(98)00230-0. Biophys Chem. 1999. PMID: 10343388
-
A decoy set for the thermostable subdomain from chicken villin headpiece, comparison of different free energy estimators.BMC Bioinformatics. 2005 Dec 14;6:301. doi: 10.1186/1471-2105-6-301. BMC Bioinformatics. 2005. PMID: 16354298 Free PMC article.
-
Discrimination between native and intentionally misfolded conformations of proteins: ES/IS, a new method for calculating conformational free energy that uses both dynamics simulations with an explicit solvent and an implicit solvent continuum model.Proteins. 1998 Sep 1;32(4):399-413. Proteins. 1998. PMID: 9726412
-
Modification and optimization of the united-residue (UNRES) potential energy function for canonical simulations. I. Temperature dependence of the effective energy function and tests of the optimization method with single training proteins.J Phys Chem B. 2007 Jan 11;111(1):260-85. doi: 10.1021/jp065380a. J Phys Chem B. 2007. PMID: 17201450 Free PMC article.
-
Distinguishing native conformations of proteins from decoys with an effective free energy estimator based on the OPLS all-atom force field and the Surface Generalized Born solvent model.Proteins. 2002 Aug 1;48(2):404-22. doi: 10.1002/prot.10171. Proteins. 2002. PMID: 12112706
Cited by
-
Computational models of protein kinematics and dynamics: beyond simulation.Annu Rev Anal Chem (Palo Alto Calif). 2012;5:273-91. doi: 10.1146/annurev-anchem-062011-143024. Epub 2012 Apr 9. Annu Rev Anal Chem (Palo Alto Calif). 2012. PMID: 22524225 Free PMC article. Review.
-
A composite score for predicting errors in protein structure models.Protein Sci. 2006 Jul;15(7):1653-66. doi: 10.1110/ps.062095806. Epub 2006 Jun 2. Protein Sci. 2006. PMID: 16751606 Free PMC article.
-
Local alignment refinement using structural assessment.PLoS One. 2008 Jul 9;3(7):e2645. doi: 10.1371/journal.pone.0002645. PLoS One. 2008. PMID: 18612410 Free PMC article.
-
Partial unfolding and refolding for structure refinement: A unified approach of geometric simulations and molecular dynamics.Proteins. 2015 Dec;83(12):2279-92. doi: 10.1002/prot.24947. Epub 2015 Nov 17. Proteins. 2015. PMID: 26476100 Free PMC article.
-
Application of MM/PBSA colony free energy to loop decoy discrimination: toward correlation between energy and root mean square deviation.Protein Sci. 2005 Apr;14(4):889-901. doi: 10.1110/ps.041004105. Protein Sci. 2005. PMID: 15772305 Free PMC article.
References
-
- Baker, D.A. 2000. The Baker Laboratory homepage. http://depts.washington.edu/bakerpg/
-
- Bauer, A. and Beyer, A. 1994. An improved pair potential to recognize native protein folds. Proteins 18 254–261. - PubMed
-
- Dill, K.A. 1990. Dominant forces in protein folding. Biochemistry 29 7133–7155. - PubMed
-
- Dinner, A.R., Sali, A., Smith, L.J., Dobson, C.M., and Karplus, M. 2000. Understanding protein folding via free-energy surfaces from theory and experiment. Trends Biochem. Sci. 25 331–339. - PubMed
-
- Dominy, B.N., and Brooks, C.L. 2001. Identifying native-like protein structures using physics-based potentials. J. Comp. Chem. (in press). - PubMed
Publication types
MeSH terms
Substances
Grants and funding
LinkOut - more resources
Full Text Sources
Other Literature Sources
Research Materials
Miscellaneous
