. 2001 Dec;183(24):7329-40.
doi: 10.1128/JB.183.24.7329-7340.2001.

Correlation between Bacillus subtilis scoC phenotype and gene expression determined using microarrays for transcriptome analysis

Affiliations

Correlation between Bacillus subtilis scoC phenotype and gene expression determined using microarrays for transcriptome analysis

R Caldwell et al. J Bacteriol. 2001 Dec.

Abstract

The availability of the complete sequence of the Bacillus subtilis chromosome (F. Kunst et al., Nature 390:249-256, 1997) makes possible the construction of genome-wide DNA arrays and the study of this organism on a global scale. Because we have a long-standing interest in the effects of scoC on late-stage developmental phenomena as they relate to aprE expression, we studied the genome-wide effects of a scoC null mutant with the goal of furthering the understanding of the role of scoC in growth and developmental processes. In the present work we compared the expression patterns of isogenic B. subtilis strains, one of which carries a null mutation in the scoC locus (scoC4). The results obtained indicate that scoC regulates, either directly or indirectly, the expression of at least 560 genes in the B. subtilis genome. ScoC appeared to repress as well as activate gene expression. Changes in expression were observed in genes encoding transport and binding proteins, those involved in amino acid, carbohydrate, and nucleotide and/or nucleoside metabolism, and those associated with motility, sporulation, and adaptation to atypical conditions. Changes in gene expression were also observed for transcriptional regulators, along with sigma factors, regulatory phosphatases and kinases, and members of sensor regulator systems. In this report, we discuss some of the phenotypes associated with the scoC mutant in light of the transcriptome changes observed.


Figures
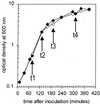
FIG. 1
FIG. 1
Growth curves for Bacillus strains BG2822 (wild type) (open diamonds) and BG2815 (scoC4) (filled diamonds). t1, t2, t3, and t4, time points used for RNA isolation and array analysis (log phase, early transition, late transition, and stationary phase, respectively).
FIG. 2
FIG. 2
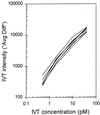
Spiked control IVT signal as a function of concentration. Final concentrations of the four control in vitro transcripts in the 200-μl hybridization cocktail (assuming an equimolar reverse transcription from RNA template to biotin-labeled cDNA): 40 pM Bleor gene, 10 pM GFP gene, 2 pM Specr gene, and 0.5 pM Eryr gene. Plotted lines are for each of the eight microarray samples (two strains; four time points).
FIG. 3
FIG. 3
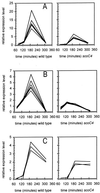
Expression patterns for several (putative or known) operons as a function of time after inoculation. Intensities were normalized twice, to whole-array median intensities for all genes and to whole-gene median intensities for all arrays. (A) Histidine-degradative genes (hutPHUIGM); (B) Ile/Val degradative pathway genes (bkdR, ptb, bcd, buk, lpd, bkdA1, bkdA2, and bkdB; formerly known as yqiRSTUV bkdAA, bkdAB, and bkdB); (C) urea utilization genes (ureABC).
FIG. 4
FIG. 4
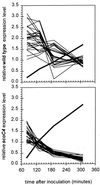
Expression patterns for the 30-gene flgB-to-sigD transcriptional cluster as a function of time after inoculation. The y axis shows the relative expression levels for 30 chemotaxis and flagellar-motility genes at position 145° to 146° in the B. subtilis genome (thin lines) and for sinI (thick line). Intensity was normalized as described for Fig. 3.
FIG. 5
FIG. 5
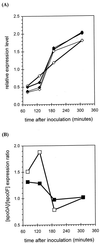
Expression patterns for spo0A and spo0F transcripts in scoC and wild-type strains. (A) Relative expression levels for spo0A (thick lines) and spo0F (thin lines) from wild-type (closed diamonds) and scoC (open diamonds) cells. Expression levels were normalized as in Fig. 3. (B) Ratio of spo0A to spo0F expression levels for wild-type (closed squares) and scoC (open squares) cells.
FIG. 6
FIG. 6
The 280-bp promoter region of the yclF gene (and the yclG gene). Start codons are underlined and in bold capitals. R.B.S., ribosomal binding site. The −10 and −35 boxes of the yclF promoter are indicated. The ScoC-binding consensus sequences overlying these promoter elements are double underlined.

References

    1. Asai K, Takamatsu H, Iwano M, Kodama T, Watabe K, Ogasawara N. The Bacillus subtilis yabQ gene is essential for formation of the spore cortex. Microbiology. 2001;147:919–927. - PubMed
    1. Debarbouille M, Gardan R, Arnaud M, Rapoport G. Role of BkdR, a transcriptional activator of the sigL-dependent isoleucine and valine degradation pathway in Bacillus subtilis. J Bacteriol. 1999;181:2059–2066. - PMC - PubMed
    1. de Saizieu A, Gardes C, Flint N, Wagner C, Kamber M, Mitchell T J, Keck W, Amrein K E, Lange R. Microarray-based identification of a novel Streptococcus pneumoniae regulon controlled by an autoinduced peptide. J Bacteriol. 2000;182:4696–4703. - PMC - PubMed
    1. Dod B, Balassa G, Raulet E, Jeannoda V. Spore control (Sco) mutations in Bacillus subtilis. II. Sporulation and the production of extracellular proteases and amylases by Sco mutants. Mol Gen Genet. 1978;163:45–56.
    1. Dowds B C, Hoch J A. Regulation of the oxidative stress response by the hpr gene in Bacillus subtilis. J Gen Microbiol. 1991;137:1121–1125. - PubMed

MeSH terms

LinkOut - more resources