. 2001 Dec 1;21(23):9134-41.
doi: 10.1523/JNEUROSCI.21-23-09134.2001.

Inhibition of dopamine release via presynaptic D2 receptors: time course and functional characteristics in vivo

Affiliations

Inhibition of dopamine release via presynaptic D2 receptors: time course and functional characteristics in vivo

M Benoit-Marand et al. J Neurosci. .

Abstract

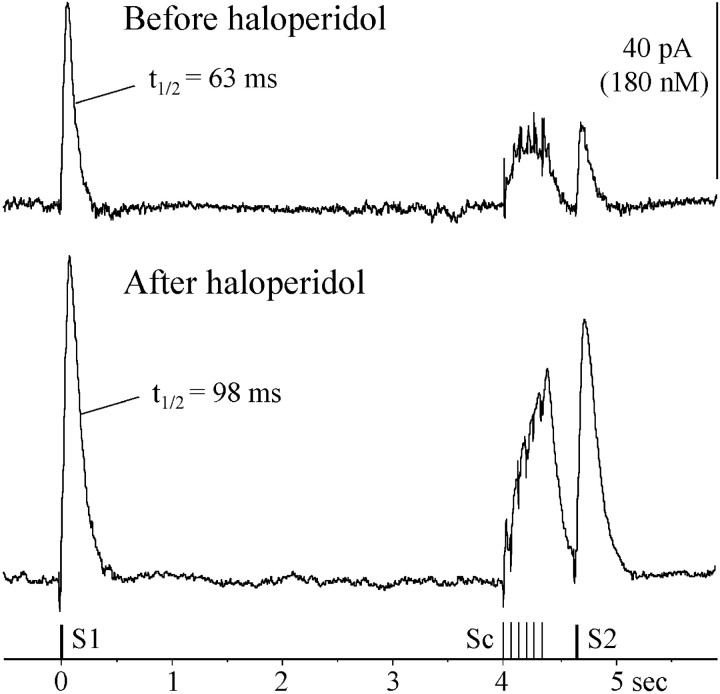
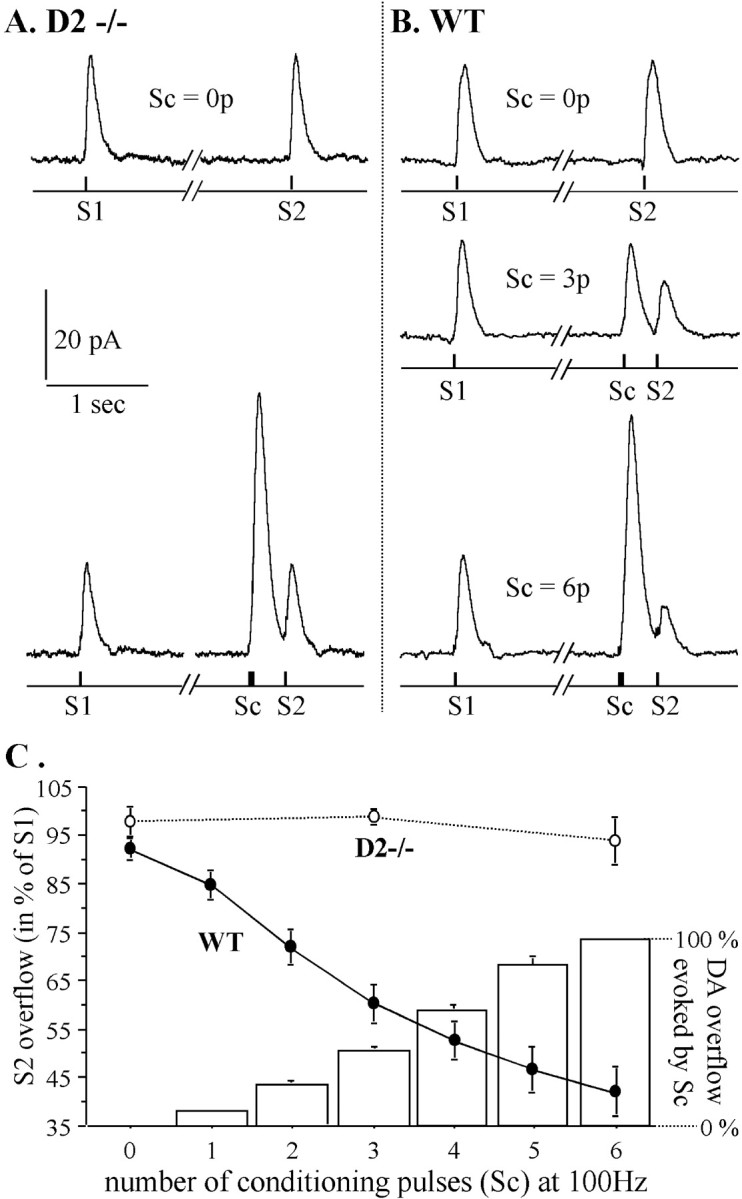
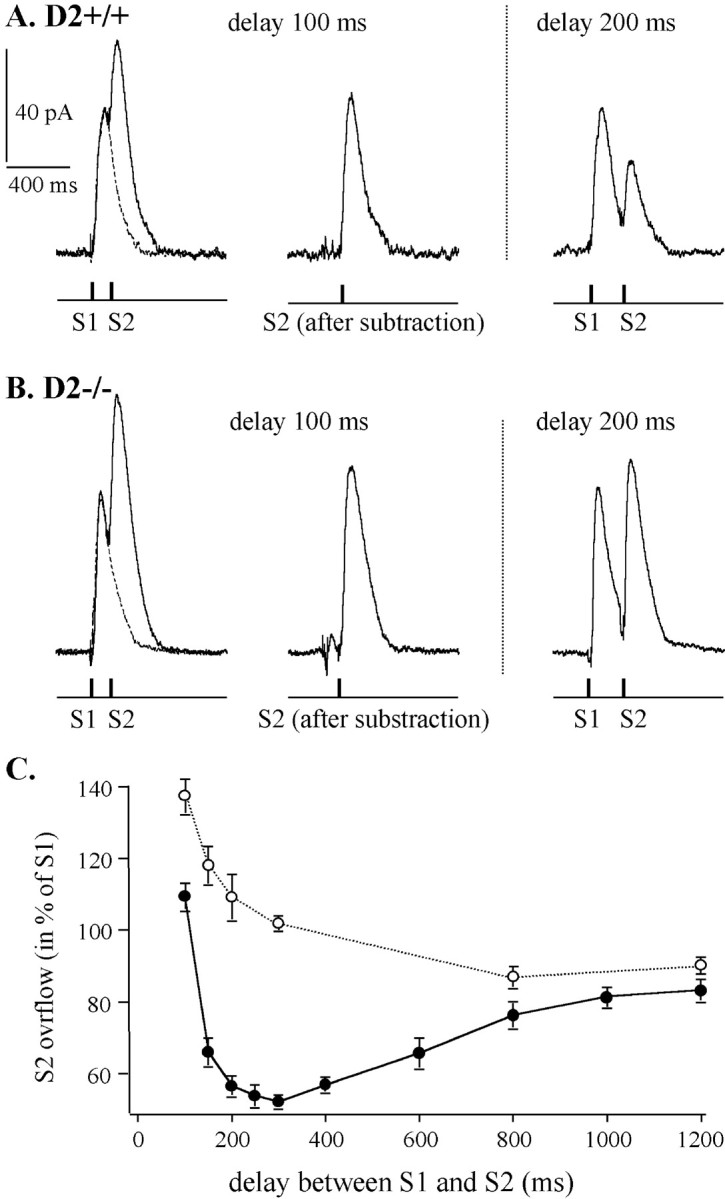
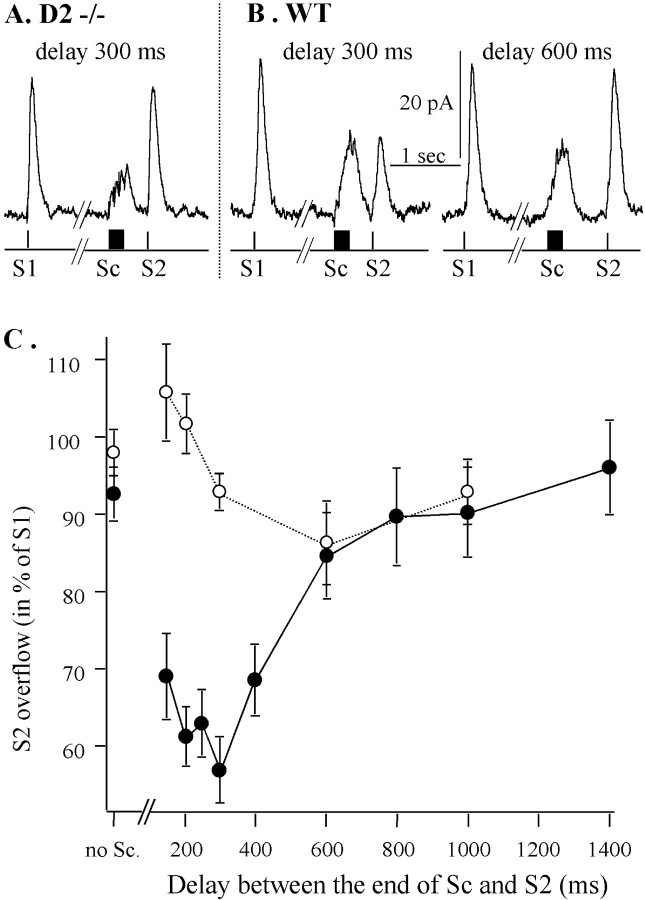
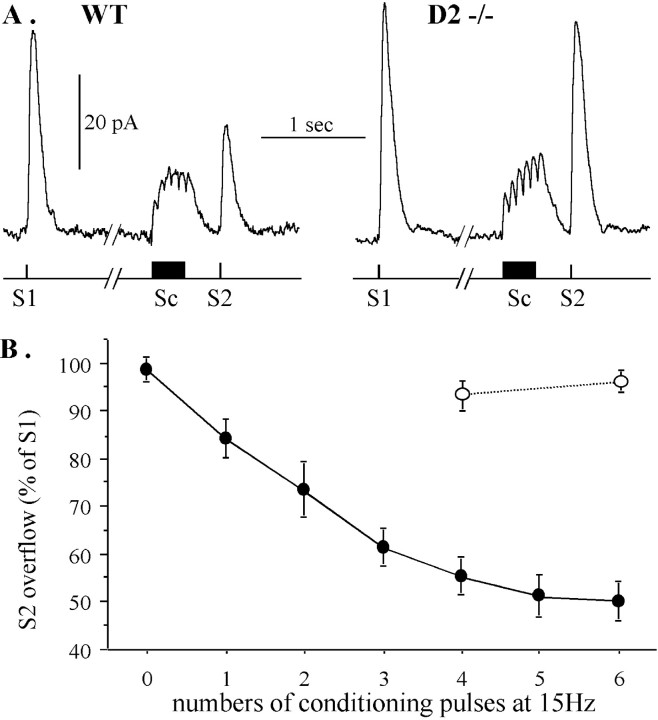
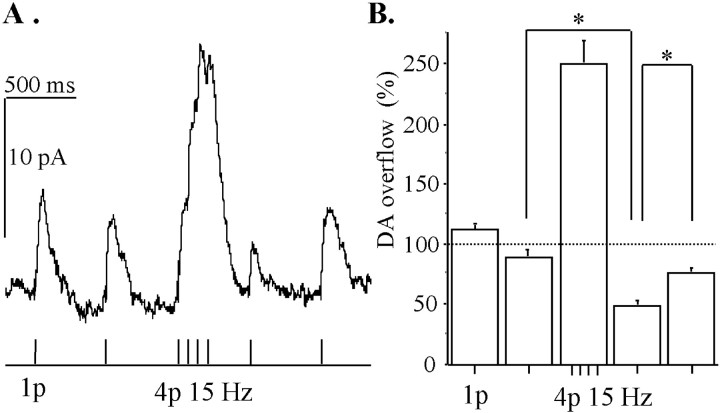
Most neurotransmitters inhibit their own release through autoreceptors. However, the physiological functions of these presynaptic inhibitions are still poorly understood, in part because their time course and functional characteristics have not been described in vivo. Dopamine inhibits its own release through D2 autoreceptors. Here, the part played by autoinhibition in the relationship between impulse flow and dopamine release was studied in vivo in real time. Dopamine release was evoked in the striatum of anesthetized mice by electrical stimulation of the medial forebrain bundle and was continuously monitored by amperometry using carbon fiber electrodes. Control experiments performed in mice lacking D2 receptors showed no autoinhibition of dopamine release. In wild-type mice, stimulation at 100 Hz with two to six pulses linearly inhibited further release, whereas single pulses were inefficient. Dopaminergic neurons exhibit two discharge patterns: single spikes forming a tonic activity below 4 Hz and bursts of two to six action potentials at 15 Hz. Stimulation mimicking one burst (four pulses at 15 Hz) promoted extracellular dopamine accumulation and thus inhibited further dopamine release. This autoinhibition was maximal between 150 and 300 msec after stimulation and disappeared within 600 msec. This delayed and prolonged time course is not reflected in extracellular DA availability and thus probably attributable to mechanisms downstream from autoreceptor stimulation. Thus, in physiological conditions, autoinhibition has two important roles. First, it contributes to the attenuation of extracellular dopamine during bursts. Second, autoinhibition elicited by one burst transiently attenuates further dopamine release elicited by tonic activity.


Figures

Fig. 1.
Fig. 1.
Effect of haloperidol on DA autoinhibition. Autoinhibition was activated by DA overflow evoked by a conditioning stimulation consisting of six pulses at 15 Hz. The resulting inhibition of DA release was measured by comparing the amplitudes of the DA overflow evoked by test stimulations S1 and S2 (3 pulses at 100 Hz) applied 4 sec before Sc and 300 msec after the end of Sc, respectively. Each sequence of three stimulations (S1-Sc-S2) was applied every 15 sec, and a series of 10 successive recordings were averaged. After a control period of 15 min, mice were treated with haloperidol (0.5 mg/kg, s.c.). The figure shows typical averaged recordings obtained from one WT mouse before and 15 min after haloperidol injection. Because the carbon fiber electrode was calibrated in vitro after in vivorecording, the evoked DA overflow was measured in picoamperes and in DA concentration (nanomolar). In six identical experiments, the amplitude of the DA overflow evoked by S2, expressed in percentage (mean ± SEM) of the overflow evoked by S1, was 43 ± 3% before haloperidol and 85 ± 4% after haloperidol. This indicates that DA autoinhibition of S2 by Sc was blocked almost entirely by haloperidol.
Fig. 2.
Fig. 2.
Relationship between the amplitude of the DA overflow evoked by MFB stimulation of one to six pulses at 100 Hz and the inhibition of DA release. Typical recordings show the DA overflow evoked by three consecutive MFB stimulations in the striatum of one D2−/− mouse (A) and of one WT mouse (B). Inhibition of DA release was measured by comparing the amplitudes of the DA overflow evoked by test stimulations S1 and S2 (3 pulses at 100 Hz). The conditioning stimulation consisted of zero to six pulses at 100 Hz and was applied 4 sec after S1. The time interval between the end of Sc and S2 was 300 msec. When Sc was 0, the time interval between S1 and S2 was 4 sec. The amplitudes of DA overflow evoked by Sc increased with increasing number of pulses, as exemplified in typical recordings and shown in percentage of the overflow evoked by six pulses at 100 Hz (mean ± SEM; 7 WT mice) (C). The amplitude of the DA overflow evoked by S2 was expressed in percentage (mean ± SEM) of the overflow evoked by S1 for D2−/− mice (○; n = 7) and WT mice (●; n = 7).
Fig. 3.
Fig. 3.
Time course of DA autoinhibition. The first test stimulation (3 pulses at 100 Hz) was the conditioning stimulation inducing autoinhibition of DA release evoked by S2. Time intervals between S1 and S2 varied from 100 to 1200 msec. Typical recordings show autoinhibition in one D2+/+ mouse (A) and its absence in one D2−/− mouse (B). For short intervals, overflow records evoked by S1 and S2 partly overlapped. To accurately measure the amplitude of the overflow evoked by S2, the curve corresponding to a similar overflow evoked by S1 but without any overlap and obtained in the same experiment was subtracted. The amplitude of autoinhibition was measured in D2−/− mice (○;n = 6) and in mice having D2 receptors (●; 4 D2+/+ mice and 10 WT mice; data pooled) (C). It corresponded to the DA overflow evoked by S2 expressed in percentage of the overflow evoked by S1 (mean ± SEM). At short time intervals (100 and 150 msec), S1 facilitated DA release evoked by S2, as observed in D2−/− mice (C). In WT mice, this facilitation was counteracted by autoinhibition. Therefore, autoinhibition was already observed at 100 msec, reached a plateau from 150 to 300 msec, and vanished at 800 msec.
Fig. 4.
Fig. 4.
Time course of autoinhibition with a conditioning stimulation of four pulses at 15 Hz. The first test stimulation (3 pulses at 100 Hz) was applied 4 sec before the conditioning stimulation, and the second test stimulation was applied between 150 and 1400 msec after the end of Sc. In the absence of Sc (no Sc), the delay between S1 and S2 was 4 sec. Typical recordings show the absence of autoinhibition in one D2−/− mouse (A) and its presence in one WT mouse (B). The DA overflow evoked by S2 was expressed in percentage of the overflow evoked by S1 (mean ± SEM) and reflected the amplitude of autoinhibition in D2−/− mice (○;n = 6) and in WT mice (●; n = 8) (C).
Fig. 5.
Fig. 5.
Relationship between the number of pulses in a conditioning stimulation at 15 Hz and DA autoinhibition. Typical recordings show the DA overflow evoked by two test stimulations and one conditioning stimulation (6 pulses at 15 Hz) in the striatum of one WT and one D2−/− mouse (A). Test stimulations (3 pulses at 100 Hz) were applied 4 sec before (S1) and 300 msec after (S2) the end of Sc. The conditioning stimulation consisted of zero to six pulses at 15 Hz. In WT mice, the maximal amplitude of the DA overflow evoked by Sc increased with increasing number of pulses from one to three and reached a plateau with the following pulses (A). In contrast, in D2−/− mice, the DA overflow evoked by Sc never reached a plateau (A). The DA overflow evoked by S2 was expressed in percentage of the overflow evoked by S1 (●; mean ± SEM; 11 WT mice) (B). In WT mice, the DA overflow evoked by Sc inhibited further DA release, and this inhibition increased by increasing Sc from two to five pulses (B). In D2−/− mice, the DA overflow evoked by Sc (4 or 6 pulses) did not inhibit further DA release (○; mean ± SEM;n = 5).
Fig. 6.
Fig. 6.
Inhibition of DA release with stimulations mimicking both discharge patterns of DA neurons. A typical recording in a WT mouse (A) shows the DA overflow evoked by single pulses at 2 Hz before and after one stimulation of four pulses at 15 Hz. The amplitude of the DA overflow observed for each stimulation is expressed in percentage (mean ± SEM;n = 10) of the averaged amplitudes of the DA overflow evoked by the two first single pulses (B). A stimulation mimicking a burst (4 pulses at 15 Hz) transiently inhibited further DA release evoked by single pulses mimicking the tonic discharge activity of dopaminergic neurons (*p = 0.005).

References

    1. Agneter E, Hoffmann IS, Singer EA, Cubeddu LX. Behavior of mesocortical dopamine terminals during single and repetitive stimulation: comparison with nigrostriatal neurons. J Pharmacol Exp Ther. 1994;269:470–476. - PubMed
    1. Aroniadou-Anderjaska V, Zhou FM, Priest CA, Ennis M, Shipley MT. Tonic and synaptically evoked presynaptic inhibition of sensory input to the rat olfactory bulb via GABA(B) heteroreceptors. J Neurophysiol. 2000;84:1194–1203. - PubMed
    1. Baik JH, Picetti R, Saiardi A, Thiriet G, Dierich A, Depaulis A, Le Meur M, Borrelli E. Parkinsonian-like locomotor impairment in mice lacking dopamine D2 receptors. Nature. 1995;377:424–428. - PubMed
    1. Benoit-Marand M, Jaber M, Gonon F. Release and elimination of dopamine in vivo in mice lacking the dopamine transporter: functional consequences. Eur J Neurosci. 2000;12:2985–2992. - PubMed
    1. Calabresi P, Pisani A, Centonze D, Bernardi G. Synaptic plasticity and physiological interactions between dopamine and glutamate in the striatum. Neurosci Biobehav Rev. 1997;21:519–523. - PubMed

Publication types

MeSH terms