. 2001 Dec 4;98(25):14464-8.
doi: 10.1073/pnas.251422998. Epub 2001 Nov 20.

Coexisting conformations of fibronectin in cell culture imaged using fluorescence resonance energy transfer

Affiliations

Coexisting conformations of fibronectin in cell culture imaged using fluorescence resonance energy transfer

G Baneyx et al. Proc Natl Acad Sci U S A. .

Abstract

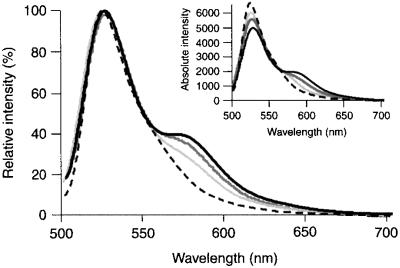
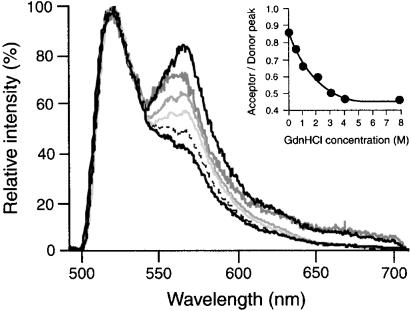
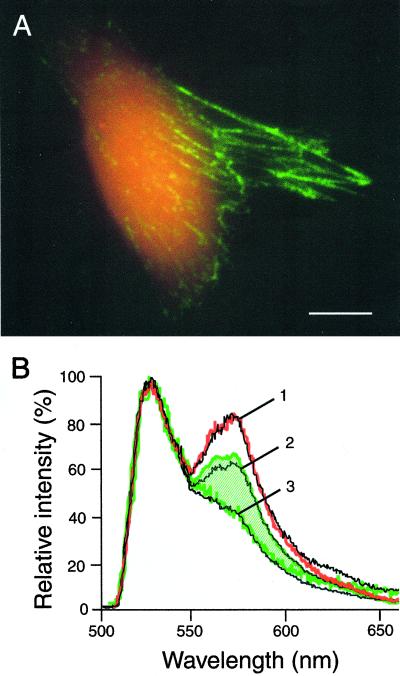
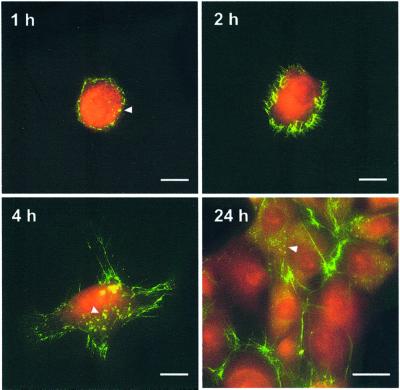
Fluorescence resonance energy transfer (FRET) between fluorophores attached to single proteins provides a tool to study the conformation of proteins in solution and in cell culture. As a protein unfolds, nanometer-scale increases in distance between donor and acceptor fluorophores cause decreases in FRET. Here we demonstrate the application of FRET to imaging coexisting conformations of fibronectin (Fn) in cell culture. Fn is a flexible 440-kDa extracellular matrix protein, with functional sites that are regulated by unfolding events. Fn was labeled with multiple donor and acceptor fluorophores such that intramolecular FRET could be used to distinguish a range of Fn conformations. The sensitivity of FRET to unfolding was tested by progressively denaturing labeled Fn using guanidium chloride. To investigate Fn conformation changes during cell binding and matrix assembly, we added labeled Fn to the culture medium of NIH 3T3 fibroblasts. Coexisting conformations of Fn were visualized using fluorescence microscopy, and spectra from specific features were measured with an attached spectrometer. Using FRET as an indicator of Fn conformation, Fn diffusely bound to cells was in a compact state, whereas Fn in matrix fibrils was highly extended. Matrix fibrils exhibited a range of FRET that suggested some degree of unfolding of Fn's globular modules. Fn in cell-associated clusters that preceded fibril formation appeared more extended than diffuse cell-bound Fn but less extended than fibrillar Fn, suggesting that Fn undergoes extension after cell binding and before polymerization. FRET thus provides an approach to gain insight into the integrin-mediated pathway of Fn fibrillogenesis.


Figures

Figure 1
Figure 1
Fluorescence emission spectra of Fn-D/A in PBS solution measured with a standard fluorescence spectrophotometer. The sensitivity of energy transfer to Fn unfolding was tested by denaturing Fn-D/A with GdnHCl at 0 (solid black), 1 (dark gray), and 4 M (light gray) in PBS. A 50–50 mixture of Fn labeled with either donor or acceptor fluorophore at the same total Fn concentration is shown for comparison (dashes). Spectra are normalized to the donor emission peak (520 nm) such that changes in energy transfer are reflected only by changes in the acceptor peak (570 nm). (Inset) Spectra before normalization.
Figure 2
Figure 2
Fluorescence emission spectra of Fn-D/A in PBS solution measured with a spectrometer attached to an epifluorescence microscope. The difference in spectral shape (compare with Fig. 1) is caused by a reduction of the low-wavelength fraction of donor emission by the microscope dichroic mirror (510-nm cutoff), a tradeoff for minimizing direct excitation of the acceptor fluorophore. FRET was measured over a range of GdnHCl concentrations: 0 (black, upper curve), 0.5 (dark gray), 1 (gray), 2 (light gray), 3 (dashed), 4 (black, lower curve), and 8 M (indistinguishable from 4 M). A mixture of unbound donor and acceptor fluorophores in PBS is indistinguishable from 4 and 8 M GdnHCl spectra. (Inset) FRET (acceptor peak intensity divided by donor peak) as a function of GdnHCl concentration.
Figure 3
Figure 3
Coexisting conformations of Fn in cell culture. (A) Superposition of donor and acceptor emission images after donor excitation. Fn-D/A diffusely bound to the cell appears red because of a high level of FRET, indicating a compact Fn conformation. Fn-D/A in the fibrillar matrix appears green because of low FRET, which suggests that Fn is in a more extended conformation. (Scale bar, 10 μm.) (B) Fluorescence emission spectra from Fn-D/A in cell culture. Diffuse cell-bound Fn-D/A (red) shows higher FRET than Fn-D/A in the fibrillar matrix (green). Fibrillar Fn-D/A exhibits a range of FRET (indicated by the hatched region). Shown in black are solution spectra of Fn, indicated by numbered lines: 1, 0 M GdnHCl; 2, 1 M GdnHCl; 3, 4 M GdnHCl.
Figure 4
Figure 4
Conformational transitions of Fn-D/A during matrix assembly. The transition of Fn-D/A from a more compact (red, high FRET) state to a more extended (green, low FRET) state is visible around the cell periphery before fibril formation (1 and 2 h). Yellow clusters of Fn-D/A were observed on regions of cells where fibrils did not yet exist (1, 4, and 24 h; arrows). (Scale bars, 10 μm in the 1-, 2-, and 4-h images and 25 μm in the 24-h image.)

References

    1. Stryer L. Annu Rev Biochem. 1978;47:819–846. - PubMed
    1. Lakowicz J R. Principles of Fluorescence Spectroscopy. New York: Plenum; 1986. pp. 305–316.
    1. Sako Y, Minoghchi S, Yanagida T. Nat Cell Biol. 2000;2:168–172. - PubMed
    1. Rye H S. Methods. 2001;24:278–288. - PMC - PubMed
    1. Deniz A A, Laurence T A, Beligere G S, Dahan M, Martin A B, Chemla D S, Dawson P E, Schultz P G, Weiss S. Proc Natl Acad Sci USA. 2000;97:5179–5184. . (First Published May 2, 2000; 10.1073/pnas.090104997) - PMC - PubMed

Publication types