. 2001 Nov 20;98(24):13643-8.
doi: 10.1073/pnas.241208698.

High refractive index substrates for fluorescence microscopy of biological interfaces with high z contrast

Affiliations

High refractive index substrates for fluorescence microscopy of biological interfaces with high z contrast

C M Ajo-Franklin et al. Proc Natl Acad Sci U S A. .

Abstract

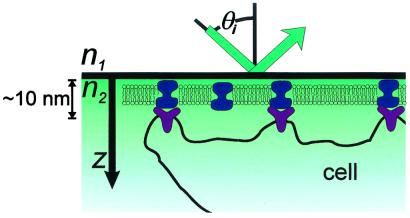
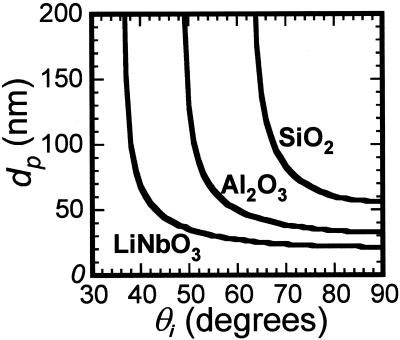
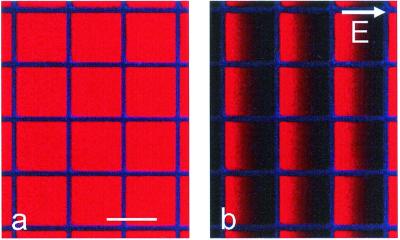
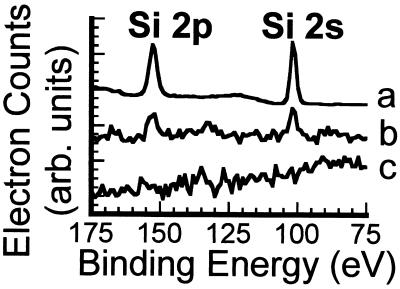
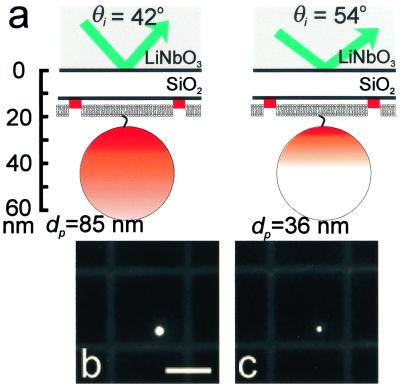
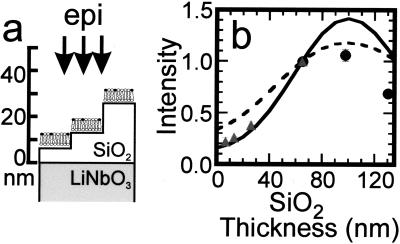
Total internal reflection fluorescence microscopy is widely used to confine the excitation of a complex fluorescent sample very close to the material on which it is supported. By working with high refractive index solid supports, it is possible to confine even further the evanescent field, and by varying the angle of incidence, to obtain quantitative information on the distance of the fluorescent object from the surface. We report the fabrication of hybrid surfaces consisting of nm layers of SiO(2) on lithium niobate (LiNbO(3), n = 2.3). Supported lipid bilayer membranes can be assembled and patterned on these hybrid surfaces as on conventional glass. By varying the angle of incidence of the excitation light, we are able to obtain fluorescent contrast between 40-nm fluorescent beads tethered to a supported bilayer and fluorescently labeled protein printed on the surface, which differ in vertical position by only tens of nm. Preliminary experiments that test theoretical models for the fluorescence-collection factor near a high refractive index surface are presented, and this factor is incorporated into a semiquantitative model used to predict the contrast of the 40-nm bead/protein system. These results demonstrate that it should be possible to profile the vertical location of fluorophores on the nm distance scale in real time, opening the possibility of many experiments at the interface between supported membranes and living cells. Improvements in materials and optical techniques are outlined.


Figures

Figure 1
Figure 1
Schematic of TIRFM imaging of a supported bilayer–cell interface illustrating the relevant vertical distance scale (the cell is not drawn to scale).
Figure 2
Figure 2
Characteristic penetration depth, dp, as a function of incidence angle θi for materials of different indices of refraction: SiO2 (n = 1.5), Al2O3 (n = 1.8), LiNbO3 (n = 2.3). The relation used was: formula image with nformula image = 1.33 and λ = 514 nm.
Figure 3
Figure 3
(a) Epifluorescence image of a supported lipid bilayer containing 1 mol % Texas red DHPE patterned with cascade blue-labeled fibronectin (50 × 50 μm grid, 4-μm wide grid lines) on a hybrid lithium niobate substrate with 13-nm SiO2. (b) The same region after application of a lateral electric field of 18 V/cm for 10 min demonstrating the formation of gradients of negatively charged Texas red DHPE. (Bar = 50 μm.)
Figure 4
Figure 4
X-ray photoelectron spectra of a hybrid lithium niobate/SiO2 substrate with 13-nm SiO2 (intensity is divided by 10) (a), a polished lithium niobate substrate (polished with colloidal silica) (b), and a polished lithium niobate substrate after cleaning with HF (c).
Figure 5
Figure 5
(a) Schematic diagram of a 40-nm fluorescently labeled bead anchored to a TR-BSA-patterned supported bilayer by a biotin/NeutrAvidin linkage on a hybrid lithium niobate/SiO2 substrate. The vertical scale provides approximate distances for a 13-nm SiO2 layer. The shading further indicates the effects of excitation using TIRFM with two different angles of incidence. For simplicity, it does not reflect that only the outer 50% radius of the bead, corresponding to 80% of the volume, contains fluorescent dye, and it does not account for the collection factor discussed in the text. In the case on the left, the penetration depth is such that the excitation intensity covers the entire bead, whereas on the right, only a portion of the bead is excited. Corresponding TIRFM images of a 40-nm NeutrAvidin-coated bead anchored to a supported lipid bilayer containing 0.5 mol % biotin PE on a hybrid lithium niobate/SiO2 substrate for (b) θi = 42° (corresponding to dp = 85 nm), and (c) θi = 52° (corresponding to dp = 36 nm). The supported membrane was patterned by microcontact printing 3.5-μm wide grid lines of TR-BSA that are separated by 25 μm. (Bar = 20 μm.)
Figure 6
Figure 6
(a) Schematic diagram of SiO2 stair steps sputtered onto lithium niobate and used to probe the effect of the high refractive index substrate on the fluorescence from 1 mol % Texas red DHPE in assembled supported bilayers. Each region of SiO2 was ≈50 mm2, so the horizontal and vertical scales are very different in this schematic. (b) Intensity of Texas red fluorescence as a function of the SiO2 thickness normalized to the fluorescence measured from the 65-nm SiO2 layer. The fluorescence was excited and collected with an epifluorescence microscope, and background was subtracted as described in Materials and Methods. The gray triangles are data acquired from a single lithium niobate substrate containing 7, 13, 26, and 65-nm layers of SiO2; the black circles are from a substrate containing 65, 98, and 130-nm layers of SiO2. Q(l) is shown by the dashed line, whereas Q(l)S(l) is shown by the solid line, where both are normalized to 1 at l = 65 nm. The parameters used to calculate Q(l) and S(l) (see text) were: N.A. = 0.45, distance of the fluorophore to the SiO2/aqueous interface = 7 nm, n3 = formula image = 2.29, n2 = formula image = 1.46, n1 = formula image = 1.33, λexcite = 585 nm, λemit = 605 nm, and Θ = π/2 (transition dipole moment of Texas red is approximately parallel to the surface; ref. 33).

References

    1. Carrington W A, Lynch R M, Moore E D W, Isenberg G, Fogarty K E, Fay F S. Science. 1995;268:1483–1487. - PubMed
    1. Gustafsson M G L, Agard D A, Sedat J W. J Microsc (Oxford) 1999;195:10–16. - PubMed
    1. Xu C, Zipfel W, Shear J B, Williams R M, Webb W W. Proc Natl Acad Sci USA. 1996;93:10763–10768. - PMC - PubMed
    1. Braun D, Fromherz P. Phys Rev Lett. 1998;81:5241–5244.
    1. Bahlmann K, Jakobs S, Hell S W. Ultramicroscopy. 2001;87:155–164. - PubMed

Publication types

LinkOut - more resources