

Using automated medical records for rapid identification of illness syndromes (syndromic surveillance): the example of lower respiratory infection
- PMID: 11722798
- PMCID: PMC60002
- DOI: 10.1186/1471-2458-1-9
Using automated medical records for rapid identification of illness syndromes (syndromic surveillance): the example of lower respiratory infection
Abstract
Background: Gaps in disease surveillance capacity, particularly for emerging infections and bioterrorist attack, highlight a need for efficient, real time identification of diseases.
Methods: We studied automated records from 1996 through 1999 of approximately 250,000 health plan members in greater Boston.
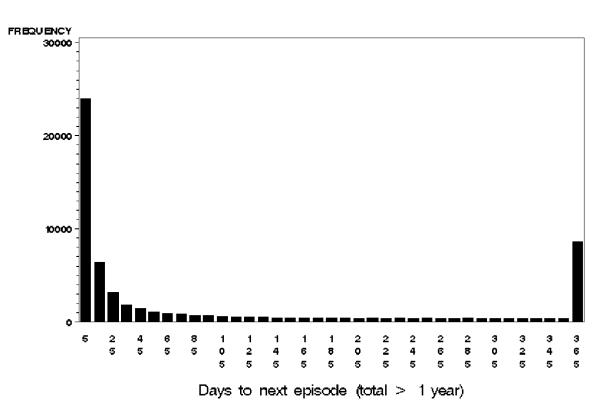
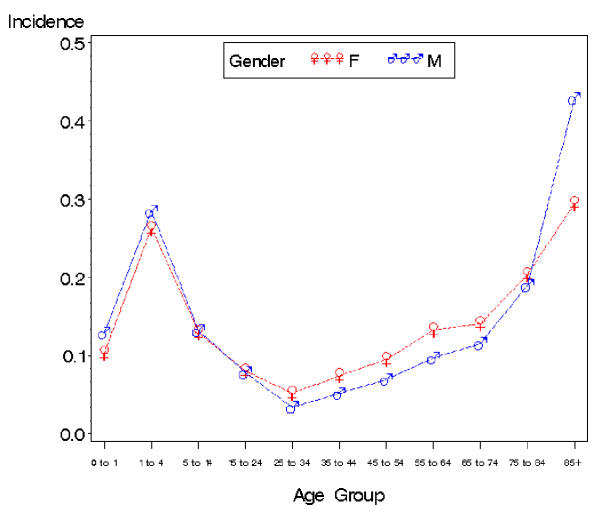
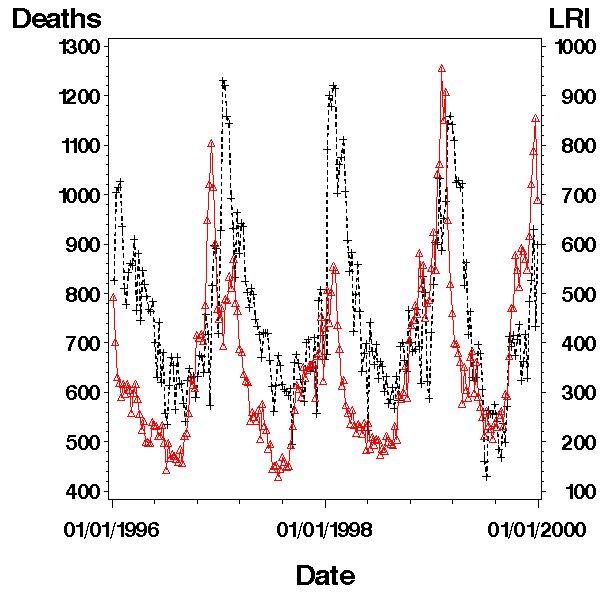
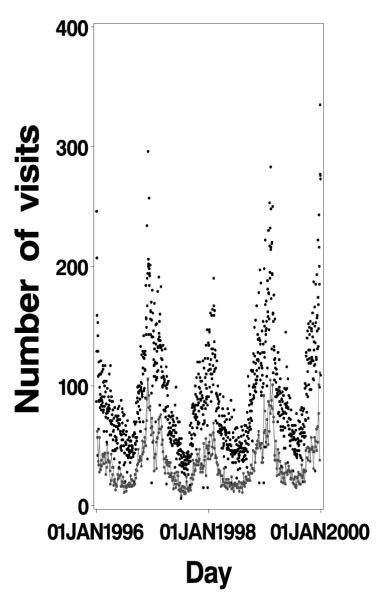
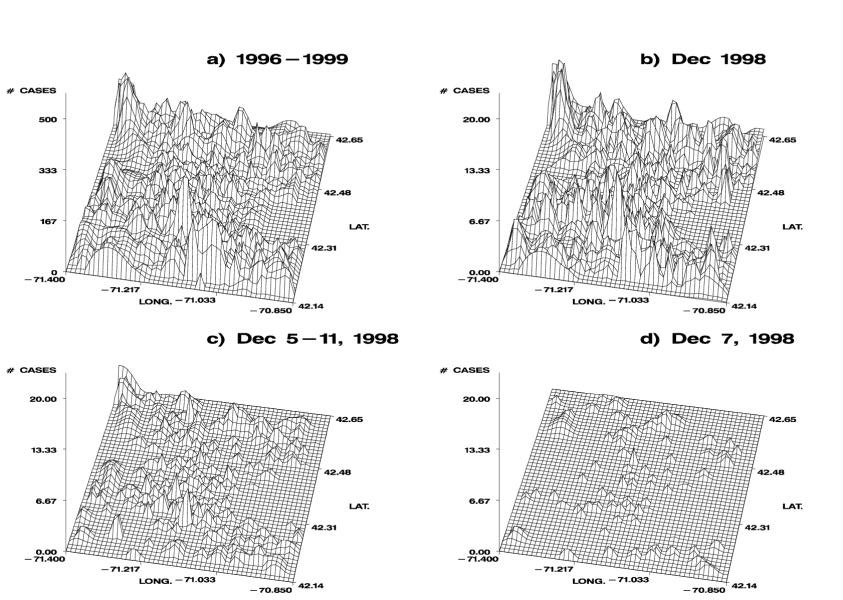
Results: We identified 152,435 lower respiratory infection illness visits, comprising 106,670 episodes during 1,143,208 person-years. Three diagnoses, cough (ICD9CM 786.2), pneumonia not otherwise specified (ICD9CM 486) and acute bronchitis (ICD9CM 466.0) accounted for 91% of these visits, with expected age and sex distributions. Variation of weekly occurrences corresponded closely to national pneumonia and influenza mortality data. There was substantial variation in geographic location of the cases.
Conclusion: This information complements existing surveillance programs by assessing the large majority of episodes of illness for which no etiologic agents are identified. Additional advantages include: a) sensitivity, uniformity and efficiency, since detection of events does not depend on clinicians' to actively report diagnoses, b) timeliness, the data are available within a day of the clinical event; and c) ease of integration into automated surveillance systems. These features facilitate early detection of conditions of public health importance, including regularly occurring events like seasonal respiratory illness, as well as unusual occurrences, such as a bioterrorist attack that first manifests as respiratory symptoms. These methods should also be applicable to other infectious and non-infectious conditions. Knowledge of disease patterns in real time may also help clinicians to manage patients, and assist health plan administrators in allocating resources efficiently.
Figures
References
-
- Baxter R, Rubin R, Steinberg C, Carroll C, Shapiro J, Yang A. Assessing core capacity for infectious disease surveillance. Final Report Prepared for: Office of the Assistant Secretary for Planning and Evaluation, DHHS, The Lewin Group, Inc. 2000. pp. 1–47.
-
- The International Classiciation of Diseases, 9th Revision, Clinical Modification. National Center for Health Statitistics. Published by Commission on professional and hospital activities, Ann Arbor, MI. 1980.
-
- Barnett GO, Justice NS, Somand ME, et al. COSTAR-a computer-based medical informatioin systrem for ambulatory care. Proc IEEE. 1979;67:1226–1237.
-
- U.S. Department of Defense GEISaRS. Annual Report, Fiscal Year 1999: Walter Reed Army Institute of Research. 1999. pp. 1–32.
-
- Centers for Disease Control and Prevention. http://www.cdc.gov/ncidod/diseases/flu/fluvirus.htm
Publication types
MeSH terms
Grants and funding
LinkOut - more resources
Full Text Sources
