. 2001 Dec;67(12):5608-13.
doi: 10.1128/AEM.67.12.5608-5613.2001.

Growth and detachment of cell clusters from mature mixed-species biofilms

Affiliations

Growth and detachment of cell clusters from mature mixed-species biofilms

P Stoodley et al. Appl Environ Microbiol. 2001 Dec.

Abstract

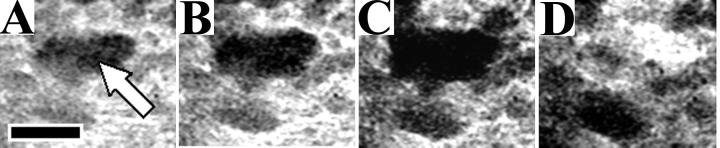
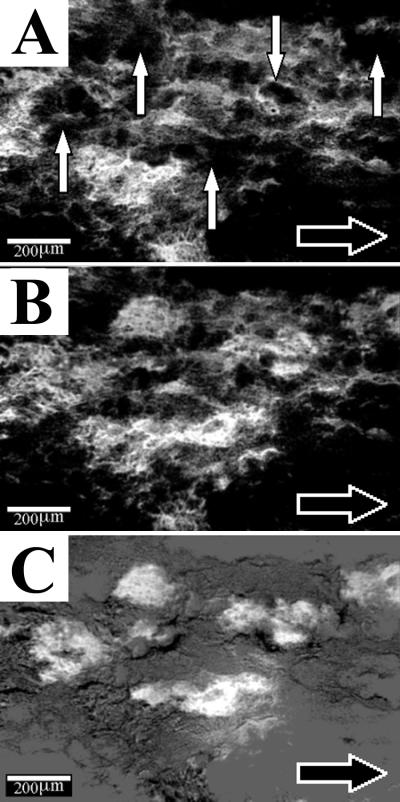
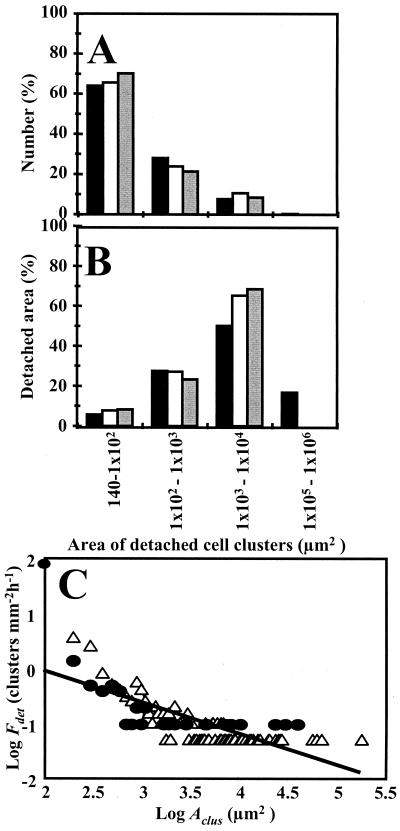
Detachment from biofilms is an important consideration in the dissemination of infection and the contamination of industrial systems but is the least-studied biofilm process. By using digital time-lapse microscopy and biofilm flow cells, we visualized localized growth and detachment of discrete cell clusters in mature mixed-species biofilms growing under steady conditions in turbulent flow in situ. The detaching biomass ranged from single cells to an aggregate with a diameter of approximately 500 microm. Direct evidence of local cell cluster detachment from the biofilms was supported by microscopic examination of filtered effluent. Single cells and small clusters detached more frequently, but larger aggregates contained a disproportionately high fraction of total detached biomass. These results have significance in the establishment of an infectious dose and public health risk assessment.


Figures

FIG. 1
FIG. 1
Growth and detachment of a representative cell cluster from the four-species biofilm. Panels A to D were taken at 2-h intervals on day 24. The arrow in panel A indicates the cell cluster. Underlying biofilm in the area beneath the detached cell cluster can be seen in panel D. Scale bar, 100 μm.
FIG. 2
FIG. 2
Detachment of biofilm cell clusters from the four-species biofilm on day 24. Image analysis was used to subtract the image made an hour earlier (A) from the subsequent image (B). The result is shown in panel C. Cell clusters that had detached (vertical white arrows in panel A) in the elapsed hour appeared white. Note that without using image subtraction, it would have been difficult to distinguish changes in the biofilm structure that had occurred between panels A and B. The horizontal black arrow indicates flow direction in the flow cell.
FIG. 3
FIG. 3
Histogram distributions of detached cell clusters in the four-species biofilm on day 24 (black bars) and day 26 (open bars) and the tap water biofilm on day 14 (gray bars). The size groups are based on the areas of the detached clusters. (A) Percentage of cell clusters detaching from each size group. (B) Proportion of detached biofilm area from each cluster size group. (C) Log-log plot of the calculated detachment frequency (Fdet) for cell clusters as a function of cell cluster area (Aclus) in the four-species biofilm on day 24 (▵) and the tap water biofilm on day 14 (●). The clusters were grouped by area into bin sizes of 100 μm2. The solid line is the linear regression of the log data and yields the empirical relationship Fdet = 14Aclus−0.58 (r2 = 0.57, n = 96).
FIG. 4
FIG. 4
Biomass particulates in the filtered tap water biofilm effluent collected on day 14. (A) Single cells and small aggregates of less than 10 cells. (B) Single cells and an aggregate containing approximately 80 cells. (C) Large aggregate containing approximately 900 cells. Scale bar, 20 μm. (D) Histogram showing the distribution of detached particles by size (white bars) and by the total number of cells in each size group (gray bars).

References

    1. Bakke R, Olsson P Q. Biofilm thickness measurements by light-microscopy. J Microbiol Methods. 1986;5:93–98.
    1. Baty A M, Eastburn C C, Techkarnjanaruk S, Goodman A E, Geesey G G. Spatial and temporal variations in chitinolytic gene expression and bacterial biomass production during chitin degradation. Appl Environ Microbiol. 2000;66:3574–3585. - PMC - PubMed
    1. Bryers J D. Modeling biofilm accumulation. In: Bazin M J, Prosser J I, editors. Physiological models in microbiology. Vol. 2. Boca Raton, Fla: CRC Press, Inc.; 1988. pp. 109–144.
    1. Characklis W G. Biofilm processes. In: Characklis W G, Marshall K C, editors. Biofilms. New York, N.Y: John Wiley & Sons, Inc.; 1990. pp. 195–231.
    1. Dalton H M, Goodman A E, Marshall K C. Diversity in surface colonization behavior in marine bacteria. J Ind Microbiol. 1996;17:228–234.

Publication types

MeSH terms

LinkOut - more resources