. 2001 Dec;67(12):5656-67.
doi: 10.1128/AEM.67.12.5656-5667.2001.

Percent G+C profiling accurately reveals diet-related differences in the gastrointestinal microbial community of broiler chickens

Affiliations

Percent G+C profiling accurately reveals diet-related differences in the gastrointestinal microbial community of broiler chickens

J H Apajalahti et al. Appl Environ Microbiol. 2001 Dec.

Abstract

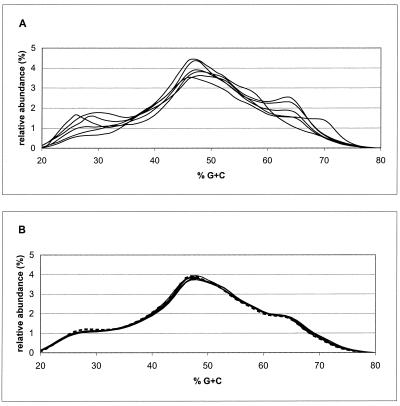
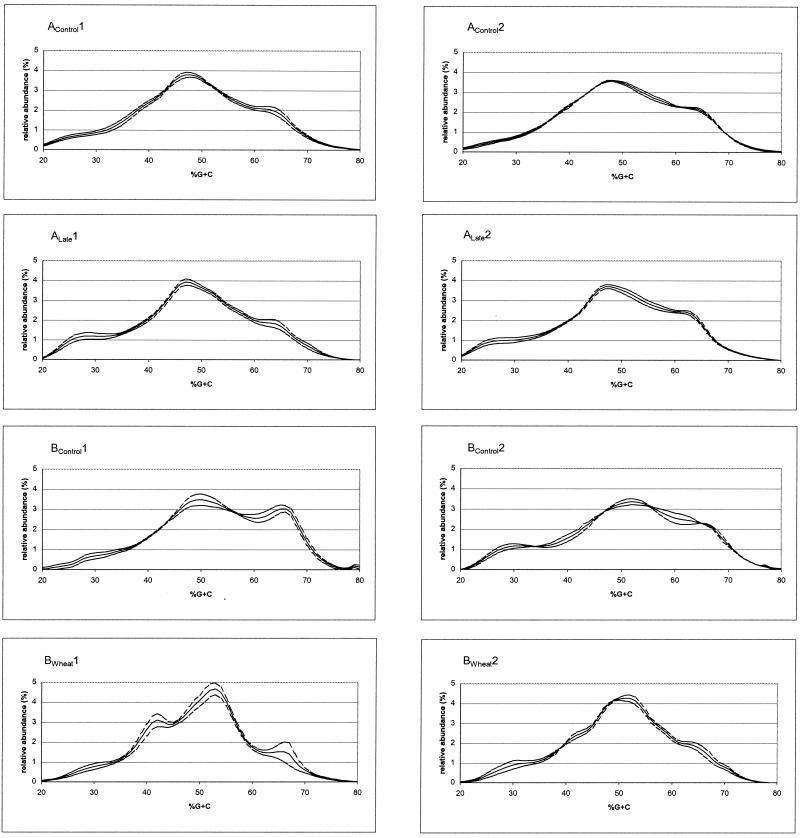
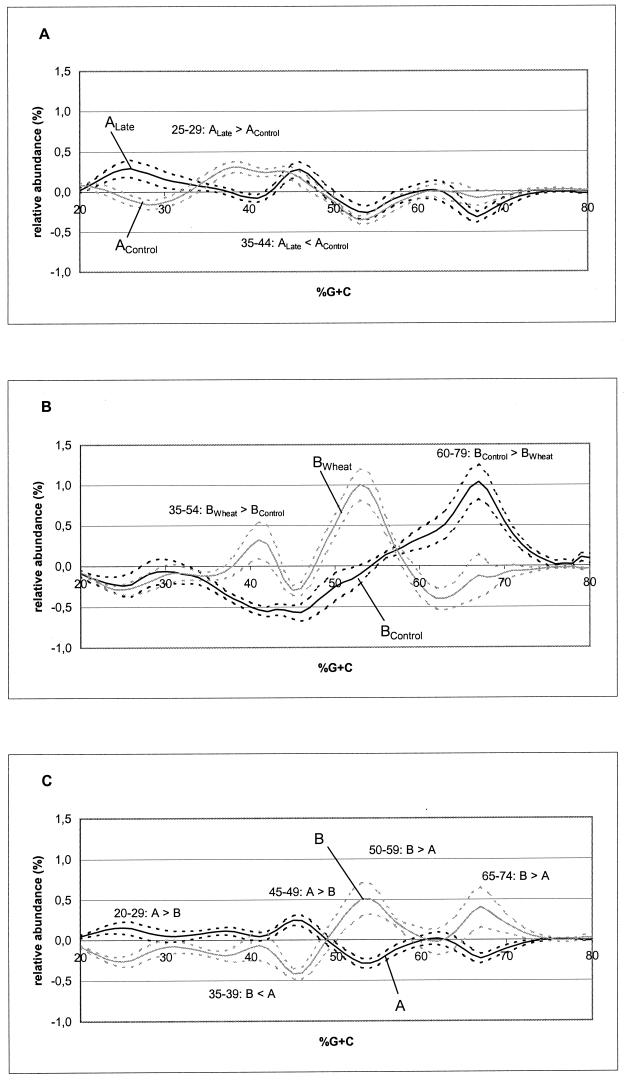
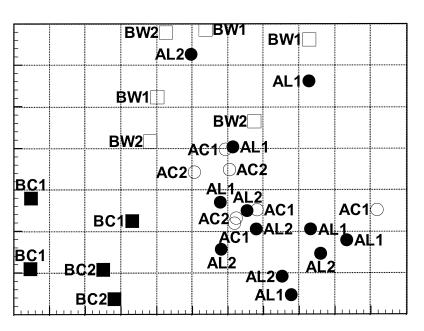
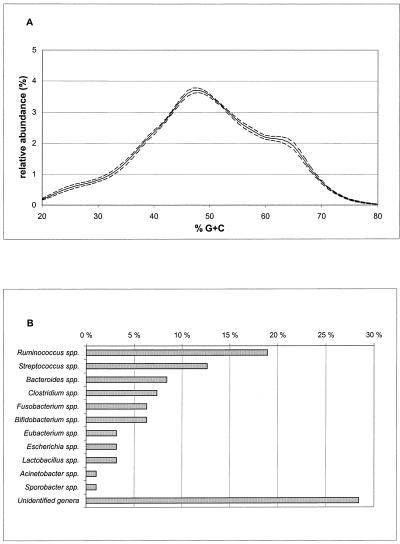
Broiler chickens from eight commercial farms in Southern Finland were analyzed for the structure of their gastrointestinal microbial community by a nonselective DNA-based method, percent G+C-based profiling. The bacteriological impact of the feed source and in-farm whole-wheat amendment of the diet was assessed by percent G+C profiling. Also, a phylogenetic 16S rRNA gene (rDNA)-based study was carried out to aid in interpretation of the percent G+C profiles. This survey showed that most of the 16S rDNA sequences found could not be assigned to any previously known bacterial genus or they represented an unknown species of one of the taxonomically heterogeneous genera, such as Ruminococcus or Clostridium. The data from bacterial community profiling were analyzed by t-test, multiple linear regression, and principal-component statistical approaches. The percent G+C profiling method with appropriate statistical analyses detected microbial community differences smaller than 10% within each 5% increment of the percent G+C profiles. Diet turned out to be the strongest determinant of the cecal bacterial community structure. Both the source of feed and local feed amendment changed the bacteriological profile significantly, whereas profiles of individual farms with identical feed regimens hardly differed from each other. This suggests that the management of typical Finnish farms is relatively uniform or that hygiene on the farm, in fact, has little impact on the structure of the cecal bacterial community. Therefore, feed compounders should have a significant role in the modulation of gut microflora and consequently in prevention of gastrointestinal disorders in farm animals.


Figures

FIG. 1
FIG. 1
Percent G+C profiles of cecal bacterial communities in broiler chickens from a commercial Finnish farm. (A) Percent G+C profiles of six individual broiler chickens from a farm using commercial feed from feed mill A (farm ALate1). (B) Six replicate percent G+C profiles of a single digesta sample obtained by pooling the six individual digesta samples of panel A (solid lines) and the arithmetic average of the individual profiles shown in panel A (dotted line).
FIG. 2
FIG. 2
Percent G+C profiles of cecal bacterial communities in broiler chickens from eight commercial farms in southern Finland. The profile in each panel shows the arithmetic average of two to six broiler chickens from each farm (solid line) and the standard error (dotted line). The heading of each graph indicates the feed manufacturer, sampling time, and feeding regimen as described in detail in Materials and Methods.
FIG. 3
FIG. 3
Characteristic effects of individual feeding regimens on bacterial community profiles. To reveal specific characteristics of each feeding regimen, the average bacterial community profile of all of the broiler chickens analyzed in this study (grand average) was subtracted from the average bacterial community profile of birds on each feeding regimen. Solid lines show the average profile of each feeding regimen, and dotted lines indicate the corresponding standard error of the mean. (A) Comparison of birds fed feed A in 1997 and 2000 (AControl versus ALate) with indication of those percent G+C increments for which feed AControl and ALate differed from each other according to t-test analysis (Table 2). (B) Comparison of birds fed feed B alone and those given feed B amended with whole wheat (BControl versus BWheat) with indication of those percent G+C increments for which feed BControl and BWheat differed from each other according to t-test analysis (Table 2). (C) Comparison of all birds with feed A in their diet to all birds with feed B in their diet (AControl and ALate versus BControl and BWheat) with indication of those percent G+C increments for which feeds A and B differed from each other according to t-test analysis (Table 3).
FIG. 4
FIG. 4
PCA of cecal percent G+C profiles of broiler chickens from eight different commercial farms. Positioning of individual broiler chickens is based on the analysis of individual percent G+C profiles using all 12 5% G+C increments collectively and is indicated by the squares (feed B) and circles (feed A). The label next to each symbol indicates the origin of the sample as follows: AC1 and AC2, farms using feed A in 1997; AL1 and AL2, farms using feed A in 2000; BC1 and BC2, farms using feed B in 1997; BW1 and BW2, farms using feed B amended with whole wheat in 1998.
FIG. 5
FIG. 5
Percent G+C profiling and 16S rDNA analyses of cecal bacterial communities in broiler chickens on two commercial farms in Finland. (A) Average percent G+C profile (solid line) and standard error (dotted lines) of cecal bacterial communities in seven broiler chickens from farms AControl1 and AControl2. (B) Relative abundance of bacterial genera or groups in the samples when analyzed by partial 16S rDNA sequencing. The bacterial genus and group names used are based on best matches to the Ribosomal Database Project II sequence database. A genus name is indicated when the best match (S_ab score) was higher than 0.7 (25).

References

    1. Afifi A A, Clark V. Principal component analysis. In: Afifi A A, Clark V, editors. Computer-aided multivariate analysis. New York, N.Y: Chapman & Hall; 1990. pp. 371–394.
    1. Amann R I, Ludwig W, Schleifer K H. Phylogenetic identification and in situ detection of individual microbial cells without cultivation. Microbiol Rev. 1995;59:143–169. - PMC - PubMed
    1. Apajalahti J H A, Särkilahti L K, Mäki B R E, Heikkinen J P, Nurminen P H, Holben W E. Effective recovery of bacterial DNA and percent-guanine-plus-cytosine-based analysis of community structure in the gastrointestinal tract of broiler chickens. Appl Environ Microbiol. 1998;64:4084–4088. - PMC - PubMed
    1. Brock T D, Madigan M T. Biology of microorganisms. Englewood Cliffs, N.J: Prentice Hall; 1991.
    1. Burr M D, Josephson K L, Pepper I L. An evaluation of ERIC PCR and AP PCR fingerprinting for discriminating Salmonella serotypes. Lett Appl Microbiol. 1998;27:24–30. - PubMed

Publication types

LinkOut - more resources