. 2001 Dec;134(7):1505-15.
doi: 10.1038/sj.bjp.0704408.

The involvement of L-type Ca(2+) channels in the relaxant effects of the ATP-sensitive K(+) channel opener ZD6169 on pig urethral smooth muscle

Affiliations

The involvement of L-type Ca(2+) channels in the relaxant effects of the ATP-sensitive K(+) channel opener ZD6169 on pig urethral smooth muscle

N Teramoto et al. Br J Pharmacol. 2001 Dec.

Abstract

1. The effects of ZD6169, a novel ATP-sensitive K(+) channel (K(ATP) channel) opener, were investigated on membrane currents in isolated myocytes using patch-clamp techniques. Tension measurement was also performed to study the effects of ZD6169 on the resting tone of pig urethral smooth muscle. 2. Levcromakalim was more potent than ZD6169 in lowering the resting urethral tone. Relaxation induced by low concentrations of ZD6169 (< or =3 microM) was completely suppressed by additional application of glibenclamide (1 microM). In contrast, glibenclamide (1-10 microM) only partially inhibited the relaxation induced by higher concentrations of ZD6169 (> or = microM). 3. Bay K8644 (1 microM) reduced the maximum relaxation produced by ZD6169 (> or =10 microM). 4. In whole-cell configuration, ZD6169 suppressed the peak amplitude of voltage-dependent Ba(2+) currents in a concentration- and voltage-dependent manner, and at 100 microM, shifted the steady-state inactivation curve of the voltage-dependent Ba(2+) currents to the left at a holding potential of -90 mV. 5. In cell-attached configuration, open probability of unitary voltage-dependent Ba(2+) channels (27 pS, 90 mM Ba(2+)) was inhibited by 100 microM ZD6169 and by 10 microM nifedipine. 6. Reverse transcriptase-polymerase chain reaction (RT - PCR) analysis revealed the presence of the transcript of the alpha(1C) subunit of L-type Ca(2+) channels in pig urethra. 7. These results demonstrate that ZD6169 causes urethral relaxation through two distinct mechanisms, activation of K(ATP) channels at lower concentrations and inhibition of voltage-dependent Ca(2+) channels at higher concentrations (about 10 microM).


Figures

Figure 1
Figure 1
The relaxing effects of ZD6169 on the resting tone of pig urethral smooth muscle strips. The dashed line indicates the mean resting tone. (a) The effects of cumulative addition of ZD6169 (0.1 – 10 μM) and after recovery, 10 μM levcromakalim. (b) Relationships between the relative value of ZD6169-induced urethral relaxation and the concentration of ZD6169. The peak amplitude of the 10 μM levcromakalim-induced relaxation was normalized as one. The curve was drawn by fitting the equation using the least-squares method, where K, D and nH are dissociation constant, concentration of glibenclamide (nM) and Hill's coefficient, respectively. The following values were used for the curve fitting: K=1.6 μM, nH=1.2 (n=6 – 9). Each symbol indicates mean with±s.d. shown by vertical lines. Some of the s.d. bars are less than the size of the symbol. The urethral relaxing curve with the broken line is for the effects of levcromakalim (K=0.3 μM, nH=2.1, n=18), and is taken from Teramoto & Ito (1999).
Figure 2
Figure 2
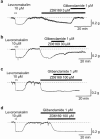
Glibenclamide-sensitive and -insensitive components of the ZD6169-induced urethral relaxation. The dashed line indicates the mean resting urethral tone. (a), (b), (c) The effects of 1 μM glibenclamide on the relaxation induced by 3 μM, (a); 30 μM, (b); 100 μM, (c); ZD6169. (d) ZD6169 (100 μM)-induced relaxation after 11 min pretreatments with 1 μM glibenclamide.
Figure 3
Figure 3
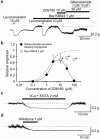
The relaxing effects of ZD6169, levcromakalim and nifedipine on the urethral tone. (a) The effects of ZD6169 and levcromakalim on the urethral tone in the absence and presence of 1 μM Bay K8644. The dashed line indicates the increased urethral tone in the presence of Bay K8644. (b) Relationships between the relative value of the glibenclamide-sensitive ZD6169-induced relaxation and the concentration of ZD6169. The peak amplitude of the 10 μM levcromakalim-induced relaxation was taken as one. Each symbol indicates mean with s.d. shown by vertical lines (n=4 – 7). The line was drawn by eye. The curve with the broken line (ZD6169) is obtained from Figure 1(b). *Significantly different from the relative value in the absence of Bay K8644 (t-test, P<0.01). (c) When extracellular Ca2+ was removed (and 2 mM EGTA added), the resting urethral tone was reversibly reduced. The dashed line indicates the mean resting urethral tone. (d) Applying 1 μM nifedipine caused an irreversible urethral relaxation. The dashed line indicates the mean resting urethral tone.
Figure 4
Figure 4
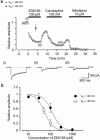
Effects of 100 μM ZD6169, 100 nM calciseptine and 10 μM nifedipine on voltage-dependent Ba2+ currents in pig urethra. Whole-cell recording, pipette solution Cs+ – TEA+ solution containing 5 mM EGTA and the bath solution 10 mM Ba2+ containing 135 mM TEA+. (a) The time course of the effects of application of the three antagonists on the relative amplitude of the voltage-dependent Ba2+ current evoked by repetitive depolarizing pulses to +10 mV from a holding potential of −50 mV. The peak amplitude of the voltage-dependent Ba2+ current just before application of ZD6169 was normalized as one (control). The inset below shows individual traces as indicated by the numbers in the graph. On some occasions no pulses were applied for the initial four min after application of 100 μM ZD6169. The solid symbols show the size of the mean value of the peak amplitude of the voltage-dependent Ba2+ current evoked by the first depolarizing pulse after this four min from two holding potentials (−50 mV, 0.79±0.09, n=6; −90 mV, 0.85±0.09, n=4). Time 0 indicates the time when 100 μM ZD6169 was applied to the bath. (b) Relationships between relative inhibition of the peak amplitude of Ba2+ current and the concentration of ZD6169 at two holding potentials (−50 mV and −90 mV). The peak amplitude of the Ba2+ current elicited by a step pulse to +10 mV from the holding potential just before application of ZD6169 was normalized as one. The curves were drawn by fitting the following equation using the least-squares method: where Ki, D and nH are the inhibitory dissociation constant, concentration of ZD6169 (μM) and Hill's coefficient, respectively. The following values were used for the curve fitting: −50 mV, Ki=55 μM, nH=2.3; −90 mV Ki=122 μM, nH=2.2. Each symbol indicates the mean of 4 – 6 observation with±s.d. shown by vertical lines. Some of the s.d. bars are less than the size of the symbol.
Figure 5
Figure 5
Inward Ba2+ currents recorded by application of depolarizing pulses at two different holding potentials (−90 and −40 mV). Whole-cell recording, pipette solution Cs+ – TEA+ solution containing 5 mM EGTA and the bath solution 10 mM Ba2+ containing 135 mM TEA+. (a)(i) Inward Ba2+ currents at each indicated depolarizing potential from both holding potentials superimposed. (ii) Inward Ba2+ current from (i) scaled to match their peak amplitudes and superimposed. (b) Current-voltage relationships of inward Ba2+ current obtained at −40 and −90 mV. The current amplitude was measured as the peak amplitude of inward Ba2+ current in each condition. The lines were drawn by eye. (c) RT – PCR detection of voltage-dependent Ca2+ channel α1C subunit mRNA. RT – PCR was performed as described in the Methods and size makers were used to indicate the size of the experimental fragments (lane 1). RT – PCR yielded visible amounts of α1C subunit (484 bp fragment) in mRNAs from pig urethra (lane 2) and rabbit cDNA of α1C subunit (lane 3).
Figure 6
Figure 6
Effects of ZD6169 on voltage-dependent Ba2+ inward currents at a holding membrane potential of −50 mV in pig urethra. The pipette solution was Cs+ – TEA+ solution containing 5 mM EGTA and the bath solution was 10 mM Ba2+ containing 135 mM TEA+. (a) (i) Original current traces before (control) and after application of 50 μM ZD6169 at the indicated pulse potentials. (ii) Inward Ba2+ current from (i) scaled to match their peak amplitudes and superimposed. (b) Current-voltage relationships obtained in the absence (control) or presence of 50 μM ZD6169. The current amplitude was measured as the peak amplitude of the Ba2+ inward current in each condition. The lines were drawn by eye. (c) Relationship between the test potential and relative value of the Ba2+ inward currents inhibited by 50 μM ZD6169, expressed as a fraction of the peak amplitude of the Ba2+ inward current evoked by various amplitude of the depolarizing pulse in the absence of ZD6169. Each symbol indicates the mean of four observations with±s.d. shown by vertical lines. The line was drawn by eye.
Figure 7
Figure 7
Effects of ZD6169 (100 μM) on the voltage-dependent inactivation of the Ba2+ inward currents in pig urethra. Whole-cell recording, pipette solution Cs+ – TEA+ solution containing 5 mM EGTA and the bath solution 10 mM Ba2+ containing 135 mM TEA+. The holding potential was −90 mV. Conditioning pulses of various amplitudes were applied (up to +30 mV, 8 s duration) before application of the test pulse (to +10 mV, 1 s duration). An interval of 20 ms was allowed between these two pulses to estimate possible contamination of the capacitive current. The peak amplitude of Ba2+ current evoked by each test pulse was measured before and after application of 100 μM ZD6169. The curves with the solid line; the peak amplitude of Ba2+ inward current in the absence and presence of ZD6169 without application of any conditioning pulse was normalized as one. The curve with the broken line was normalized to the current at +10 mV upon stepping from −90 mV in 100 μM ZD6169. The lines were drawn by fitting the data to the following equation in the least-squares method, where I, Imax, V, Vhalf, k and C are the relative amplitude of Ba2+ inward currents observed at various amplitudes of the conditioning pulse (I) and observed with application of the conditioning pulse of −90 mV (Imax), amplitude of the conditioning pulse (V), and that where the amplitude of Ba2+ inward current was reduced to half (Vhalf), slope factor (k) and fraction of the non-inactivating component of Ba2+ inward current (C). The curves in the absence or presence of ZD6169 were drawn using the following values: (control), Imax=1.0, Vhalf=−30.7, k=8.5 and C=0.14; (ZD6169, 100 μM), Imax=0.69, Vhalf=−47.2, k=8.5 and C=0.04. Each symbol indicates the mean of four observations with±s.d. shown by vertical lines. Some of the s.d. bars are less than the size of the symbol.
Figure 8
Figure 8
Unitary Ba2+ currents recorded in cell-attached patches of pig urethral myocytes. The pipette was filled with 90 mM Ba2+ solution and 142 mM K+ solution was superfused in the bath. (a) The unitary Ba2+ currents were obtained using a depolarizing pulse (400 ms duration, 10 s interval) from a holding potential of −90 mV to the indicated membrane potential (from −40 mV to +20 mV). The average currents from 10 null traces (the nearest five traces before and after the event in which the channel did not open) were subtracted. The dashed line indicates the current base line where the channel is not open. (b) Current-voltage relationships of the unitary Ba2+ current obtained from −40 mV to +20 mV. The amplitude of the Ba2+ channel currents was taken from the all-points amplitude histograms at each depolarizing potential. The line was fitted by the least-squares method. The channel conductance was 27 pS (27.3±1.9 pS, n=8).
Figure 9
Figure 9
Effects of ZD6169 on the unitary Ba2+ current in pig urethra at a holding potential of −30 mV. High K+ (142 mM) solution was superfused in the bath and high Ba2+ (90 mM) solution in the pipette. Bay K8644 (1 μM) had been included in the pipette solution. (a) Application of 100 μM ZD6169 (5 min duration) reduced the activity of the 1.9 pA Ba2+ channel. After removal of ZD6169, 3 min later, application of nifedipine (10 μM) abolished channel activity. Lower traces show expansions of the upper trace (1 kHz filtration; 80 μs digital sampling interval). The open horizontal bars in the absence and presence of 100 μM ZD6169 indicate the duration (2 min) of the traces analysed in (b). The dashed line indicates the current when the channel is not open. (b) All-point amplitude histograms in the absence (obtained during the last 2 min just before application of ZD6169) and presence of 100 μM ZD6169 (obtained during 2 min of a 5 min application). Continuous lines in the histograms are theoretical curves fitted with the Gaussian distribution, by the least-squares method. The abscissa scales show the amplitude of the current (pA) and the ordinate scales show the percentage value of the probability density function (per cent) for the recording period (2 min). (c) Each column shows the relative level of the activity of the 1.9 pA Ba2+ channel (mean value with+s.d.) when the mean open probability of the channel activity was normalized as one just before application of each concentration of ZD6169 (n=5).

Similar articles

Cited by

References

    1. BOLTON T.B., PRESTWICH S.A., ZHOLOS A.V., GORDIENKO D.V. Excitation-contraction coupling in gastrointestinal and other smooth muscles. Annu. Rev. Physiol. 1999;61:85–115. - PubMed
    1. BUCKNER S.A., MILICIC I., DAZA A., DAVIS-TABER R., SCOTT V.E., SULLIVAN J.P., BRIONI J.D. Pharmacological and molecular analysis of ATP-sensitive K+ channels in the pig and human detrusor. Eur. J. Pharmacol. 2000;400:287–295. - PubMed
    1. COTTON K.D., HOLLYWOOD M.A., MCHALE N.G., THORNBURY K.D. Ca2+ current and Ca2+-activated chloride current in isolated smooth muscle cells of the sheep urethra. J. Physiol. 1997;505:121–131. - PMC - PubMed
    1. GOPALAKRISHNAN M., WHITEAKER K.L., MOLINARI E.J., DAVIS-TABER R., SCOTT V.E., SHIEH C.C., BUCKNER S.A., MILICIC I., CAIN J.C., POSTL S., SULLIVAN J.P., BRIONI J.D. Characterization of the ATP-sensitive potassium channels (KATP) expressed in guinea pig bladder smooth muscle cells. J. Pharmacol. Exp. Ther. 1999;289:551–558. - PubMed
    1. HOWE B.B., HALTERMAN T.J., YOCHIM C.L., DO M.L., PETTINGER S.J., STOW R.B., OHNMACHT C.J., RUSSELL K., EMPFIELD J.R., TRAINOR D.A., BROWN F.J., KAU S.T. ZENECA ZD6169: A novel KATP channel opener with in vivo selectivity for urinary bladder. J. Pharmacol. Exp. Ther. 1995;274:884–890. - PubMed

Publication types

MeSH terms

LinkOut - more resources