

The nature of fluorescence emission in the red fluorescent protein DsRed, revealed by single-molecule detection
- PMID: 11724943
- PMCID: PMC64692
- DOI: 10.1073/pnas.251525598
The nature of fluorescence emission in the red fluorescent protein DsRed, revealed by single-molecule detection
Abstract
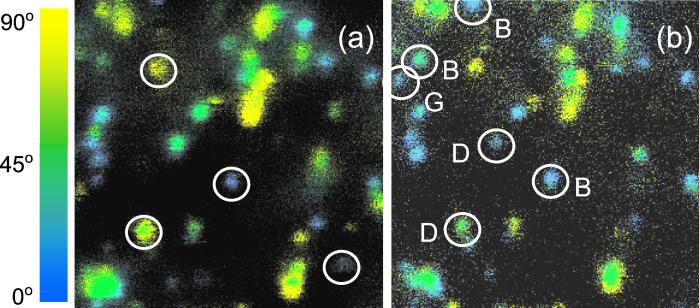
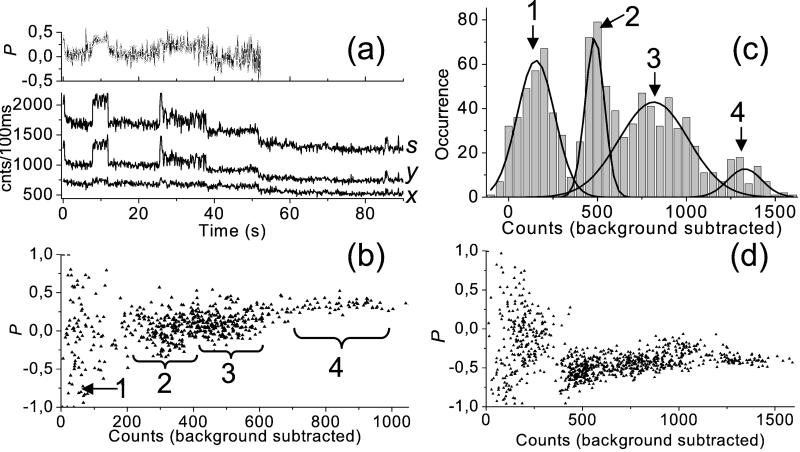
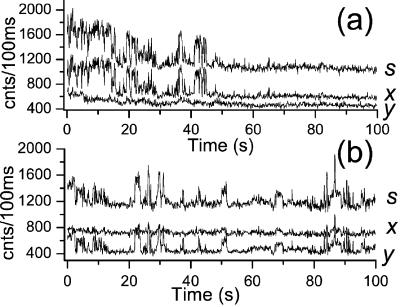
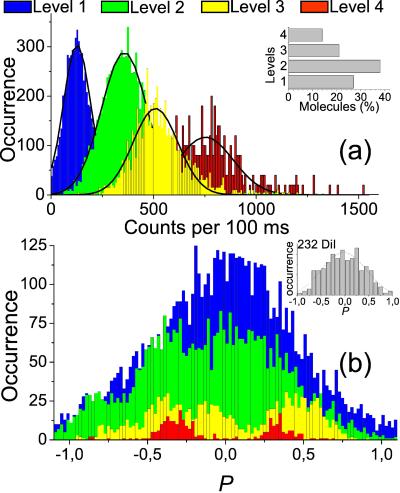
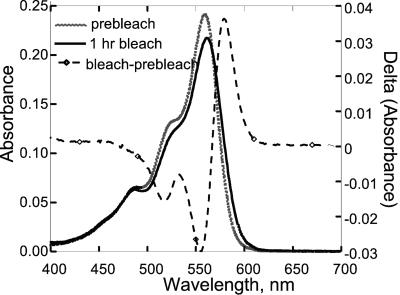
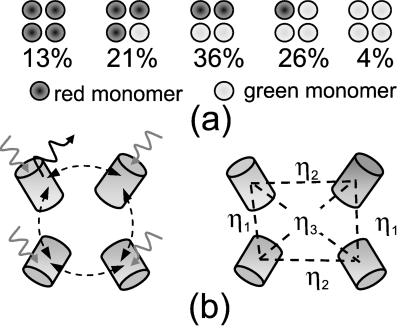
Recent studies on the newly cloned red fluorescence protein DsRed from the Discosoma genus have shown its tremendous advantages: bright red fluorescence and high resistance against photobleaching. However, it has also become clear that the protein forms closely packed tetramers, and there is indication for incomplete protein maturation with unknown proportion of immature green species. We have applied single-molecule methodology to elucidate the nature of the fluorescence emission in the DsRed. Real-time fluorescence trajectories have been acquired with polarization sensitive detection. Our results indicate that energy transfer between identical monomers occurs efficiently with red emission arising equally likely from any of the chromophoric units. Photodissociation of one of the chromophores weakly quenches the emission of adjacent ones. Dual color excitation (at 488 and 568 nm) single-molecule microscopy has been performed to reveal the number and distribution of red vs. green species within each tetramer. We find that 86% of the DsRed contain at least one green species with a red-to-green ratio of 1.2-1.5. On the basis of our findings, oligomer suppression would not only be advantageous for protein fusion but will also increase the fluorescence emission of individual monomers.
Figures
Similar articles
-
New insights into the photophysics of DsRed by multiparameter spectroscopy on single proteins.J Phys Chem B. 2008 Jun 26;112(25):7669-74. doi: 10.1021/jp7114753. Epub 2008 Jun 4. J Phys Chem B. 2008. PMID: 18528973
-
The structural basis for red fluorescence in the tetrameric GFP homolog DsRed.Nat Struct Biol. 2000 Dec;7(12):1133-8. doi: 10.1038/81992. Nat Struct Biol. 2000. PMID: 11101896
-
Rapidly maturing variants of the Discosoma red fluorescent protein (DsRed).Nat Biotechnol. 2002 Jan;20(1):83-7. doi: 10.1038/nbt0102-83. Nat Biotechnol. 2002. PMID: 11753367
-
Recent advances using green and red fluorescent protein variants.Appl Microbiol Biotechnol. 2007 Nov;77(1):1-12. doi: 10.1007/s00253-007-1131-5. Epub 2007 Aug 18. Appl Microbiol Biotechnol. 2007. PMID: 17704916 Review.
-
Anthozoa red fluorescent protein in biosensing.Anal Bioanal Chem. 2006 Oct;386(3):515-24. doi: 10.1007/s00216-006-0652-6. Epub 2006 Aug 1. Anal Bioanal Chem. 2006. PMID: 16924380 Review.
Cited by
-
α-SNAP regulates dynamic, on-site assembly and calcium selectivity of Orai1 channels.Mol Biol Cell. 2016 Aug 15;27(16):2542-53. doi: 10.1091/mbc.E16-03-0163. Epub 2016 Jun 22. Mol Biol Cell. 2016. PMID: 27335124 Free PMC article.
-
Red Fluorescent Protein Variant with a Dual-Peak Emission of Fluorescence.Mar Biotechnol (NY). 2023 Dec;25(6):1099-1109. doi: 10.1007/s10126-023-10262-z. Epub 2023 Oct 21. Mar Biotechnol (NY). 2023. PMID: 37864761
-
Quantitative transcription factor binding kinetics at the single-molecule level.Biophys J. 2009 Jan;96(2):609-20. doi: 10.1016/j.bpj.2008.09.040. Biophys J. 2009. PMID: 19167308 Free PMC article.
-
A theoretical justification for single molecule peptide sequencing.PLoS Comput Biol. 2015 Feb 25;11(2):e1004080. doi: 10.1371/journal.pcbi.1004080. eCollection 2015 Feb. PLoS Comput Biol. 2015. PMID: 25714988 Free PMC article.
-
Accurate construction of photoactivated localization microscopy (PALM) images for quantitative measurements.PLoS One. 2012;7(12):e51725. doi: 10.1371/journal.pone.0051725. Epub 2012 Dec 12. PLoS One. 2012. PMID: 23251611 Free PMC article.
References
-
- Matz M V, Fradkov A F, Labas Y A, Savitsky A P, Zaraisky A G, Markelov M L, Lukyanov S A. Nat Biotechnol. 1999;17:969–973. - PubMed
-
- Chalfie M Y, Euskirchen Tu G, Ward W W, Prasher D C. Science. 1994;263:802–805. - PubMed
-
- Tsien R Y. Annu Rev Biochem. 1998;67:509–544. - PubMed
-
- Fradkov A F, Chen Y, Ding L, Barsova E V, Matz M V, Lukyanov S A. FEBS Lett. 2000;479:127–130. - PubMed
-
- Mizuno H, Sawano A, Eli P, Hama H, Miyawaki A. Biochemistry. 2001;40:2502–2510. - PubMed
Publication types
MeSH terms
Substances
LinkOut - more resources
Full Text Sources
Other Literature Sources
