Comparative Study
. 2001 Dec 4;98(25):14380-5.
doi: 10.1073/pnas.251530598. Epub 2001 Nov 27.

Comparison of a hair bundle's spontaneous oscillations with its response to mechanical stimulation reveals the underlying active process

Affiliations
Comparative Study

Comparison of a hair bundle's spontaneous oscillations with its response to mechanical stimulation reveals the underlying active process

P Martin et al. Proc Natl Acad Sci U S A. .

Abstract

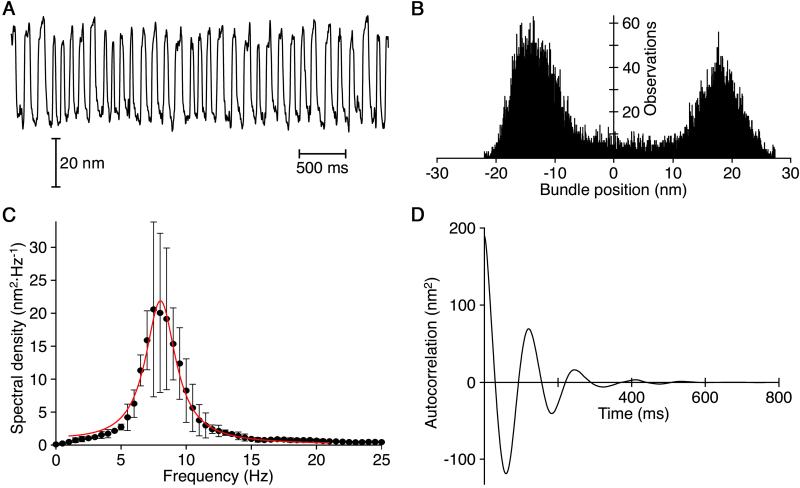
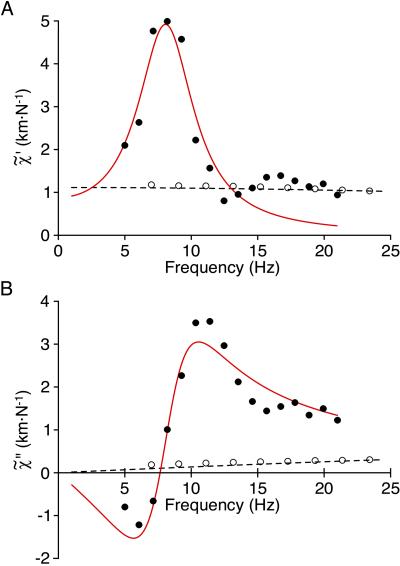
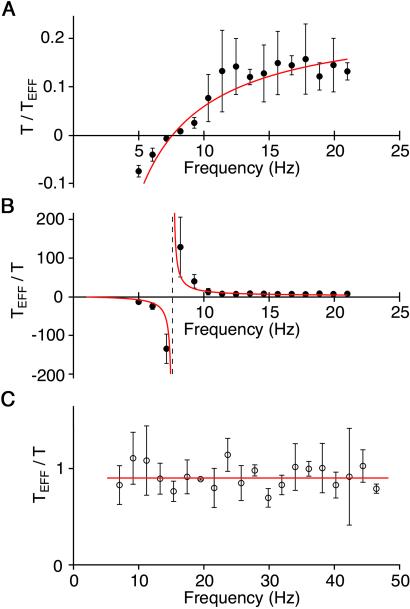
Hearing relies on active filtering to achieve exquisite sensitivity and sharp frequency selectivity. In a quiet environment, the ears of many vertebrates become unstable and emit one to several tones. These spontaneous otoacoustic emissions, the most striking manifestation of the inner ear's active process, must result from self-sustained mechanical oscillations of aural constituents. The mechanoreceptive hair bundles of hair cells in the bullfrog's sacculus have the ability to amplify mechanical stimuli and oscillate spontaneously. By comparing a hair bundle's spontaneous oscillations with its response to small mechanical stimuli, we demonstrate a breakdown in a general principle of equilibrium thermodynamics, the fluctuation-dissipation theorem. We thus confirm that a hair bundle's spontaneous movements are produced by energy-consuming elements within the hair cell. To characterize the dynamical behavior of the active process, we introduce an effective temperature that, for each frequency component, quantifies a hair bundle's deviation from thermal equilibrium. The effective temperature diverges near the bundle's frequency of spontaneous oscillation. This behavior, which is not generic for active oscillators, can be accommodated by a simple model that characterizes quantitatively the fluctuations of the spontaneous movements as well as the hair bundle's linear response function.


Figures

Figure 1
Figure 1
Properties of spontaneous oscillations at ∼8 Hz by a hair bundle from the sacculus of the bullfrog's inner ear. (A) Monitoring the position of a glass fiber attached at the hair bundle's top measured the bundle's spontaneous movement. This oscillation had a root–mean–square magnitude of 28 nm. The data were smoothed by forming the running average of a number of points equal to one-fifth of a cycle, and drift in the baseline was subtracted. (B) The probability distribution of bundle positions was bimodal, with a local minimum near the bundle's mean position. This histogram is asymmetrical; the bundle spent more time during negative than positive deflections. (C) The signal's spectrum displayed a broad peak and was fitted by Eq. 21 (smooth curve). We found D = 0.14 pN2⋅s, λ = 9 μN⋅s⋅m−1, k = 80 μN⋅m−1, and ν0 = ω0/(2π) = 8 Hz; the ratio λ/k = 115 ms characterized the correlation time of the bundle's movements. To obtain the spectrum, we averaged the spectral densities computed from 15 measurements of bundle oscillations, each 2 s in length. The resulting spectrum was further smoothed by forming the running average of the number of points sampling a 1-Hz frequency band. The error bars specify standard deviations from these mean values. (D) The autocorrelation function of bundle motion, obtained as the inverse Fourier transform of the spectral density, revealed an average oscillation frequency of ∼8 Hz. The signal's envelope, which relaxed towards zero with an exponential time constant of 115 ms, reflected the period over which the oscillation's phase lost coherence. Analog signals were sampled at a frequency of 2.5 kHz. B, C, and D derive from the data shown in A.
Figure 2
Figure 2
Linear response function as a function of stimulus frequency for an oscillatory hair bundle (●) and a control bundle that did not show marked oscillations (○). (A) In the case of the oscillating hair bundle, the real part of the response function, χ̃′(ω), which measures the bundle's elastic component of the response, shows a distinct peak near 8 Hz, the bundle's frequency of spontaneous oscillation. (B) The imaginary part of the response function, χ̃"(ω), portrays the dissipative component of motion. For the oscillating bundle of Fig. 1, this crosses the abscissa at a frequency near that of the bundle's spontaneous oscillations. From the fits of the measured response function χ̃(ω) by Eq. 20, we found for the oscillatory bundle (smooth curve) λ = 6.5 μN⋅s⋅m−1, k = 104 μN⋅m−1, and ν0 = ω0/(2π) = 8.1 Hz. These values imply that k̄ = 1040 μN⋅m−1 and provide a relaxation time for bundle motion of τ = 65 ms. Applied to the control cell, the same model yielded (dotted line) λ = 1.7 μN⋅s⋅m−1, k = 900 μN⋅m−1, and ν0 = ω0/(2π) ≈ 0 Hz; the corresponding relaxation time was τ = 2 ms. The bundle's response function was measured by applying a succession of 50-cycle stimuli of increasing frequency separated by 2-s rests; the amplitude of stimulation was 15 nm for the oscillatory cell and 300 nm for the control cell. The periods during which the bundle was not stimulated were used to compute the characteristics of the bundle's spontaneous motion shown in Fig. 1.
Figure 3
Figure 3
The effective temperature of spontaneous hair-bundle motion. (A) For the oscillatory bundle of Figs. 1 and 2, the inverse of the effective temperature, normalized by the actual temperature, T/TEFF(ω), crossed zero near the bundle's frequency of spontaneous oscillation. This ratio deviated strikingly at all frequencies from the value of unity indicative of passive motion and thus violated the FDT. (B) A plot of the normalized effective temperature, TEFF(ω)/T, exhibits a divergence corresponding to the crossing of the abscissa in A. The smooth lines correspond to a fit to the data by Eq. 22. (C) For the control hair bundle whose response function is shown by open symbols in Fig. 2, the normalized effective temperature TEFF(ω)/T remained near unity throughout the range of frequencies. This behavior, which satisfies the FDT, demonstrated that the hair bundle was passive and that its fluctuations resulted from thermal bombardment.

References

    1. Probst R. Adv Otorhinolaryngol. 1990;44:1–91. - PubMed
    1. Manley G A, Köppl C. Curr Opin Neurobiol. 1998;8:468–474. - PubMed
    1. Manley G. Proc Natl Acad Sci USA. 2000;97:11736–11743. - PMC - PubMed
    1. Ruggero M A, Kramek B, Rich N C. Hear Res. 1984;13:293–296. - PubMed
    1. Gold T. Proc R Soc London Ser B. 1948;135:492–498.

Publication types