

Lipopolysaccharide-induced leptin release is neurally controlled
- PMID: 11724949
- PMCID: PMC64748
- DOI: 10.1073/pnas.251543598
Lipopolysaccharide-induced leptin release is neurally controlled
Abstract
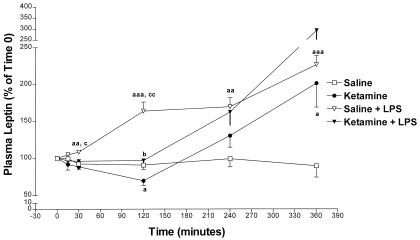
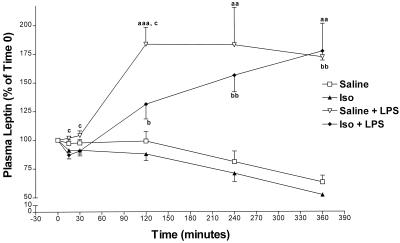
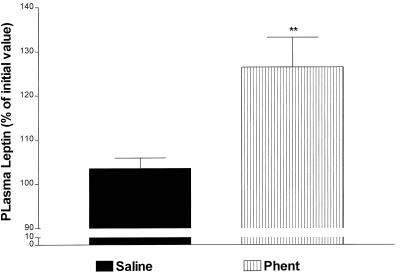
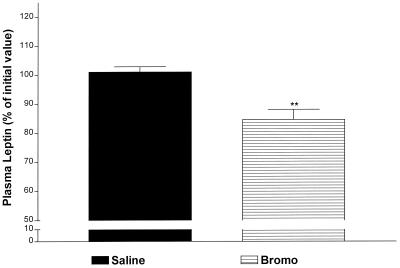
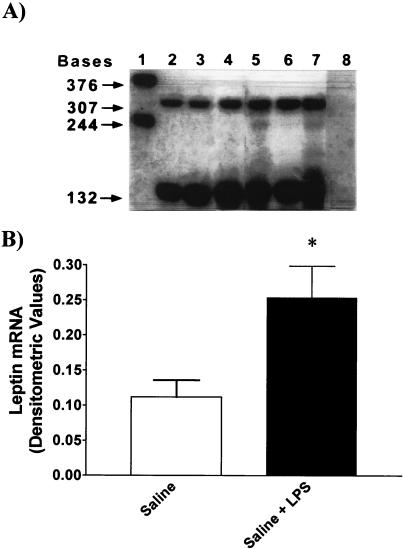
Our hypothesis is that leptin release is controlled neurohormonally. Conscious, male rats bearing indwelling, external, jugular catheters were injected with the test drug or 0.9% NaCl (saline), and blood samples were drawn thereafter to measure plasma leptin. Anesthesia decreased plasma leptin concentrations within 10 min to a minimum at 120 min, followed by a rebound at 360 min. Administration (i.v.) of lipopolysaccharide (LPS) increased plasma leptin to almost twice baseline by 120 min, and it remained on a plateau for 360 min, accompanied by increased adipocyte leptin mRNA. Anesthesia largely blunted the LPS-induced leptin release at 120 min. Isoproterenol (beta-adrenergic agonist) failed to alter plasma leptin but reduced LPS-induced leptin release significantly. Propranolol (beta-receptor antagonist) produced a significant increase in plasma leptin but had no effect on the response to LPS. Phentolamine (alpha-adrenergic receptor blocker) not only increased plasma leptin (P < 0.001), but also augmented the LPS-induced increase (P < 0.001). alpha-Bromoergocryptine (dopaminergic-2 receptor agonist) decreased plasma leptin (P < 0.01) and blunted the LPS-induced rise in plasma leptin release (P < 0.001). We conclude that leptin is at least in part controlled neurally because anesthesia decreased plasma leptin and blocked its response to LPS. The findings that phentolamine and propranolol increased plasma leptin concentrations suggest that leptin release is inhibited by the sympathetic nervous system mediated principally by alpha-adrenergic receptors because phentolamine, but not propranolol, augmented the response to LPS. Because alpha-bromoergocryptine decreased basal and LPS-induced leptin release, dopaminergic neurons may inhibit basal and LPS-induced leptin release by suppression of release of prolactin from the adenohypophysis.
Figures


Similar articles
-
Lipopolysaccharide-induced tumor necrosis factor-alpha release is controlled by the central nervous system.Neuroimmunomodulation. 2001;9(3):148-56. doi: 10.1159/000049019. Neuroimmunomodulation. 2001. PMID: 11752888
-
Adrenergic receptors in the nucleus accumbens shell differentially modulate dopamine and acetylcholine receptor-mediated turning behaviour.Eur J Pharmacol. 2007 Jan 12;554(2-3):175-82. doi: 10.1016/j.ejphar.2006.10.007. Epub 2006 Oct 17. Eur J Pharmacol. 2007. PMID: 17113067
-
Adrenergic regulation of distention-induced gastrin release in humans.Gastroenterology. 1982 Apr;82(4):659-63. Gastroenterology. 1982. PMID: 6120877
-
Exogenous and endogenous catecholamines inhibit the production of macrophage inflammatory protein (MIP) 1 alpha via a beta adrenoceptor mediated mechanism.Br J Pharmacol. 1998 Nov;125(6):1297-303. doi: 10.1038/sj.bjp.0702179. Br J Pharmacol. 1998. PMID: 9863660 Free PMC article.
-
The effect of alpha- and beta-adrenergic agonists and blockers on postprandial pancreatic polypeptide release in dogs.Scand J Gastroenterol. 1983 Jan;18(1):87-90. doi: 10.3109/00365528309181564. Scand J Gastroenterol. 1983. PMID: 6144174
Cited by
-
Role of the blood-brain barrier in the evolution of feeding and cognition.Ann N Y Acad Sci. 2012 Aug;1264(1):13-9. doi: 10.1111/j.1749-6632.2012.06568.x. Epub 2012 May 21. Ann N Y Acad Sci. 2012. PMID: 22612379 Free PMC article.
-
Chronic Leptin Deficiency Improves Tolerance of Physiological Damage and Host-Pathogen Cooperation during Yersinia pseudotuberculosis Infection.Infect Immun. 2022 Sep 15;90(9):e0024222. doi: 10.1128/iai.00242-22. Epub 2022 Aug 4. Infect Immun. 2022. PMID: 35924898 Free PMC article.
-
Reward mechanisms in obesity: new insights and future directions.Neuron. 2011 Feb 24;69(4):664-79. doi: 10.1016/j.neuron.2011.02.016. Neuron. 2011. PMID: 21338878 Free PMC article. Review.
-
Temporal gene expression in the hippocampus and peripheral organs to endotoxin-induced systemic inflammatory response in caspase-1-deficient mice.Neuroimmunomodulation. 2015;22(4):263-73. doi: 10.1159/000368310. Epub 2015 Jan 24. Neuroimmunomodulation. 2015. PMID: 25633245 Free PMC article.
-
Adipokines as Diagnostic and Prognostic Markers for the Severity of COVID-19.Biomedicines. 2023 Apr 27;11(5):1302. doi: 10.3390/biomedicines11051302. Biomedicines. 2023. PMID: 37238973 Free PMC article. Review.
References
-
- McCann S M, Kimura M, Yu W H, Mastronardi C A, Rettori V, Karanth S. In: Vitamins and Hormone. Litwack G, editor. New York: Academic; 2001. pp. 29–62. - PubMed
-
- Wong M L, Rettori V, Al-Shekhlee A, Bongiorno P B, Canteros G, McCann S M, Gold P W, Licinio J. Nat Med. 1996;5:581–584. - PubMed
-
- McCann S M, Kimura M, Karanth S, Yu W H, Rettori V. Ann NY Acad Sci. 1998;840:174–184. - PubMed
-
- Gottschall P E, Komaki G, Arimura A. Neuroendocrinology. 1992;6:935–938. - PubMed
-
- Rettori V, Dees W L, Hiney J K, Lyson K, McCann S M. Neuroimmunomodulation. 1994;1:251–258. - PubMed
Publication types
MeSH terms
Substances
Grants and funding
LinkOut - more resources
Full Text Sources
