. 2001 Dec 4;98(25):14732-7.
doi: 10.1073/pnas.261293398. Epub 2001 Nov 27.

A transcriptional roadmap to wood formation

Affiliations

A transcriptional roadmap to wood formation

M Hertzberg et al. Proc Natl Acad Sci U S A. .

Abstract

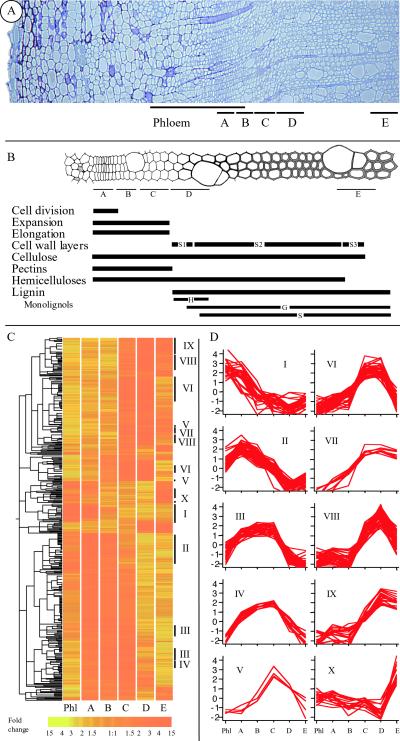
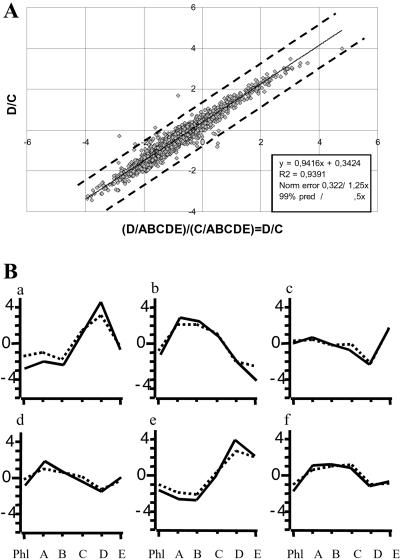
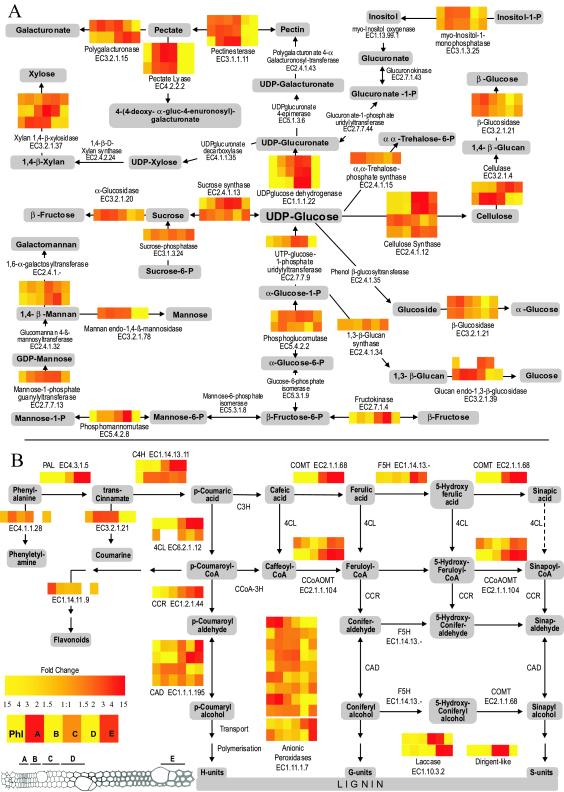
The large vascular meristem of poplar trees with its highly organized secondary xylem enables the boundaries between different developmental zones to be easily distinguished. This property of wood-forming tissues allowed us to determine a unique tissue-specific transcript profile for a well defined developmental gradient. RNA was prepared from different developmental stages of xylogenesis for DNA microarray analysis by using a hybrid aspen unigene set consisting of 2,995 expressed sequence tags. The analysis revealed that the genes encoding lignin and cellulose biosynthetic enzymes, as well as a number of transcription factors and other potential regulators of xylogenesis, are under strict developmental stage-specific transcriptional regulation.


Figures

Figure 1
Figure 1
(A) Cross section of a hybrid aspen stem stained with Toluidine blue. Black bars indicate the location of the sampled tissues. The phloem sample was included to give a low-resolution picture of the gene expression in the other tissue derived from the cambium. (B) Schematic representation of different cell-types and stages during vascular development. Bars depict timing and extent of the different developmental stages and the appearance of the major cell wall components. (C) Hierarchical cluster analysis of 1,791 selected genes with differential expression in the sampled tissues. The color scale at the bottom depicts fold change between samples. (D) Groups of genes with different differential expression patterns, expression ratios in log2 scale. The samples are indicated at the bottom of the figure.
Figure 2
Figure 2
Quality control. (A) Variability between hybridizations. The mean of expression ratios from hybridization D/(ABCDE) were divided by the expression ratios from C/(ABCDE), and plotted against the mean of expression ratios D/C (data from hybridizing sample D against sample C), in log2 scale. Based on these data, we estimate that a 1.5-fold difference in expression would be significant to 99% confidence. A small error component (1.2-fold) occurring from the normalization procedure, observed as the crossing of the regression line and the x axis at −0.3, increases the limit for significant expression ratios to >1.8-fold difference. A dashed line shows the 2-fold error line. (B). The expression profiles obtained from the array experiments were validated by dot blotting the cDNA populations on a nylon filter and hybridizing it with six different ESTs by using radioactively labeled probes. Control hybridizations in black lines and array data in dashed lines plotted in log2 scale. Data from the control hybridizations are normalized to an average of one for each individual gene. (a) AI163298, unknown; (b) AI164300, transcription factor; (c) AI161744, KNAP2 homologue; (d) AI166228, transcription factor; (e) AI161452, CAD (EC1.1.1.195); (f) AI164228, ATHB-9.
Figure 3
Figure 3
Expression profiles. Log2 transformed ratios. (A) Cyclins: cycA-like (black line, AI165944), cycH-like (dotted line, AI165594), cycA-like (red line, AI164102) and cycB-like (blue line, AI163933). (B) cdc2 like (black line, AI163933) and cks1-like (dotted line, AI163057). (C) ATHB-9 homologue (AI164228) in black and ATHB-8 homologue(AI165328) in gray. (D) A KNAP2 homologue of the Knotted class (AI161604). (E) Ribosomal proteins. (F) Six different MYB-domain transcription factors: AI163812 in red, AI164087 in dark blue, AI161768 in dark green, AI165848 in light blue, AI161482 in purple, and AI163448 in yellow. (G and H) Tubulin genes organized in two different expression clusters: Tubulin a (black lines) and Tubulin b (dotted lines). Data are presented as log2 transformed ratios.
Figure 4
Figure 4
Metabolic pathways related to cell-wall formation. The metabolites are presented in gray boxes; arrows represent enzymatic reactions. Colored bars next to arrows indicate relative expression ratios of the corresponding gene in the different tissue samples. (A) Selected steps in the carbohydrate metabolic pathway important for the formation of cell-wall components. Genes included (with accession nos. in parentheses) EC3.1.1.11 (AI164340, AI164970, AI165089), EC4.2.2.2 (AI163756, AI162298, AI162963), EC3.2.1.15 (AI163516, AI164358), EC3.2.1.37 (AI164515, AI162157, AI163643), EC2.4.1.15 (AI163996), EC1.1.1.22 (AI163328, AI162135, AI166238), EC2.4.1.13 (AI162073, AI163591), EC3.1.3.24 (AI165881), EC3.2.1.20 (AI163888), EC2.7.7.9 (AI16198), EC2.4.1.12 (AI163338, AI164546, AI162632), EC3.2.1.4 (AI164537, AI162370), EC3.2.1.21 (AI162064, AI161473), EC5.4.2.2 (AI162727, AI165714), EC2.4.1.34 (AI164628), EC3.2.1.39 (AI162475, AI164898), EC2.7.1.4 (AI162647), EC5.4.2.8 (AI162548), EC2.7.7.13 (AI165373), EC3.2.1.78 (AI162354), EC2.4.1.- (AI161536, AI161661), and EC3.1.3.25 (AI162400, AI165680). (B) Metabolic pathway for lignin biosynthesis; included genes EC4.1.1.28 (AI161926), phenylalanine ammonia-lyase (PAL) EC4.3.1.5 (AI166034), EC3.2.1.21 (AI163643), cinnamate 4-hydroxylase (C4H) EC1.14.13.11 (AI164016, AI164359), caffeate O-methyltransferase (COMT) EC2.1.1.68 (AI162318), ferulate 5-hydroxylase (F5H) EC1.14.13.- (AI166206), 4-coumarate:CoA ligase (4CL) EC6.2.1.12 (AI163594 and AI162611), caffeoyl CoA O-methyltransferase (CCoAOMT) EC2.1.1.104 (AI165013, AI165215), EC1.14.11.9 (AI163786), cinnamoyl-CoA reductase (CCR) EC1.2.1.44 (AI163319), cinnamyl alcohol dehydrogenase (CAD) EC1.1.1.195 (AI165107, AI161452, AI164048, AI164606), Peroxidases AI163015 and AI163276, Laccase EC1.10.3.2 (AI165655 and AI165982), Dirigent-like (AI163758).

References

    1. White K P, Rifkin S A, Hurban P, Hogness D S. Science. 1999;286:2197–2184. - PubMed
    1. Aharoni A, Keizer L C, Bouwmeester H J, Sun Z, Alvarez-Huerta M, Verhoeven H A, Blaas J, van Houwelingen A M, De Vos R C, van der Voet H, et al. Plant Cell. 2000;12:647–662. - PMC - PubMed
    1. Uggla C, Moritz T, Sandberg G, Sundberg B. Proc Natl Acad Sci USA. 1996;93:9282–9286. - PMC - PubMed
    1. Schena M, Shalon D, Davis R W, Brown P O. Science. 1995;270:467–470. - PubMed
    1. Sterky F, Regan S, Karlsson J, Hertzberg M, Rohde A, Holmberg A, Amini B, Bhalerao R, Larsson M, Villarroel R, et al. Proc Natl Acad Sci USA. 1998;95:13330–13335. - PMC - PubMed

Publication types

Associated data