Comparative Study
. 2001 Dec 4;98(25):14693-7.
doi: 10.1073/pnas.261432998. Epub 2001 Nov 27.

Candidate odorant receptors from the malaria vector mosquito Anopheles gambiae and evidence of down-regulation in response to blood feeding

Affiliations
Comparative Study

Candidate odorant receptors from the malaria vector mosquito Anopheles gambiae and evidence of down-regulation in response to blood feeding

A N Fox et al. Proc Natl Acad Sci U S A. .

Abstract

Olfaction plays a major role in host preference and blood feeding, integral behaviors for disease transmission by the malaria vector mosquito Anopheles gambiae sensu stricto (henceforth A. gambiae). We have identified four genes encoding candidate odorant receptors from A. gambiae that are selectively expressed in olfactory organs, contain approximately seven transmembrane domains, and show significant similarity to several putative odorant receptors in Drosophila melanogaster. Furthermore, one of the putative A. gambiae odorant receptors exhibits female-specific antennal expression and is down-regulated 12 h after blood feeding, a period during which substantial reduction in olfactory responses to human odorants has been observed. Taken together, these data suggest these genes encode a family of odorant receptors in A. gambiae, whose further study may aid in the design of novel antimalarial programs.


Figures

Figure 1
Figure 1
Deduced amino acid alignments and genomic structure of AgORs. (A) clustalx (v1.62b) (14) alignment viewed in SeqVu (The Garvan Institute of Medical Research) of AgOr1 and Or46a and Or46b, its closest related DORs, and AgOr2 and Or43a, its closest related DOR. For all alignments, similarity shading is based on an 85% Goldman–Engelman–Steitz (GES) scale, and identity shading is based on a 65% scale (35) with SeqVu. (B) clustalx (v1.62b) (14) alignment viewed in SeqVu of AgORs. Transmembrane domains are indicated by dashed boxes and are numbered below. (C) Schematic representation of the intron/exon structure of AgORs and the chromosomal linkage between AgOr3 and AgOr4. The position and relative size of exons and introns are drawn to scale as indicated. (D) AgOr3 and AgOr4 intron/exon colinearity. Like-filled boxes represent corresponding exons between deduced amino acid sequences for exon 1 of AgOr3 and AgOr4 (hatched); exons 2 and 3 of AgOr3 and exon 2 of AgOr4 (gray); exons 4–6 of AgOr3 and exon 3 of AgOr4 (black).
Figure 2
Figure 2
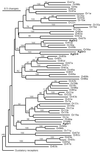
Phylogenetic analysis of AgORs. Phylogenetic tree showing relationships of the four AgORs (bold type) to those from D. melanogaster. The tree was rooted with 32 representatives of the D. melanogaster gustatory receptor family. Numbers above branches are the percentage of 1,000 bootstrap replication trees that branch, with only those above 50% shown. The OR family can be readily recognized on several sequence and gene structure features, yet has only 48% bootstrap support, and there is no support for the backbone of the relationships within the family. The scale bar indicates 50% divergence, using distance corrected with maximum likelihood and the blosum62 matrix.
Figure 3
Figure 3
Olfactory tissue-specific expression of AgORs. Male and female (combined) A. gambiae antennae and maxillary palps (O, olfactory tissue), heads stripped of olfactory tissues (H), legs (L), or bodies devoid of appendages (B) were used to generate RNA for RT-PCR. Reaction products, visualized under UV illumination after staining with ethidium bromide, represent the amplification of (A) AgOr1 (559 bp), (B) AgOr2 (474 bp), (C) AgOr3 (286 bp), and (D) AgOr4 (309 bp) (indicated by white arrowhead) along with each respective rps7 control product (458 bp). Higher molecular weight PCR products in AgOr1 (H), AgOr2 (O, H), and AgOr4 (H) represent amplified genomic DNA contamination of RNA samples. A no-template negative (−) control ensures the specificity of the amplicons, and a genomic DNA template (G) reaction indicates the relative position of PCR product derived from genomic DNA contamination in experimental samples. The position of molecular weight markers (bp) is indicated Left.
Figure 4
Figure 4
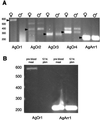
(A) Female-specific expression of AgOr1. Four- to 5-day-old male and female antennae were used to generate RNA for RT-PCR. AgOr1 RT-PCR product (559 bp) is detectable only in female antennae, whereas AgOr2 (474 bp), AgOr3 (286 bp), and AgOr4 (309 bp) are amplified from both male and female antennae. Arrowheads indicate cDNA products; larger bands result from genomic DNA contamination of cDNA templates. An olfactory gene, AgArr1 (231 bp), is amplified as a control. The position of molecular weight markers (in base pairs) is indicated to the left of the panel. (B) Down-regulation of AgOr1 expression after blood meal (pbm). Antennae from 4- to 5-day-old females before blood meal and females 12 h after blood meal were used to generate RNA for RT-PCR. AgOr1 PCR product (559 bp) is detectable only in antennae before blood meal. AgArr1 (231 bp) is amplified as a control.

Similar articles

Cited by

References

    1. Hildebrand J G, Shepherd G M. Annu Rev Neurosci. 1997;20:595–631. - PubMed
    1. Takken W. Insect Sci Appl. 1991;12:287–295.
    1. Collins F H, Paskewitz S M. Annu Rev Entomol. 1995;40:195–219. - PubMed
    1. Mombaerts P. Annu Rev Neurosci. 1999;22:487–509. - PubMed
    1. Pilpel Y, Sosinsky A, Lancet D. Essays Biochem. 1998;33:93–104. - PubMed

Publication types

Substances

Associated data

LinkOut - more resources