. 2001 Dec 3;20(23):6591-600.
doi: 10.1093/emboj/20.23.6591.

Specific roles of protein-phospholipid interactions in the yeast cytochrome bc1 complex structure

Affiliations

Specific roles of protein-phospholipid interactions in the yeast cytochrome bc1 complex structure

C Lange et al. EMBO J. .

Abstract

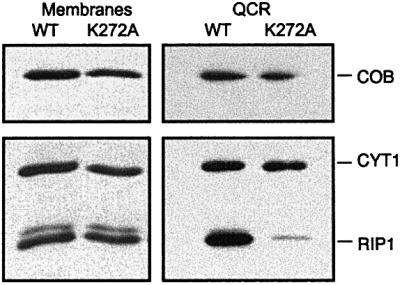
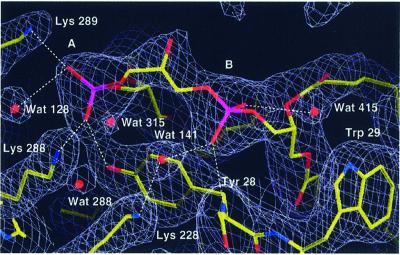
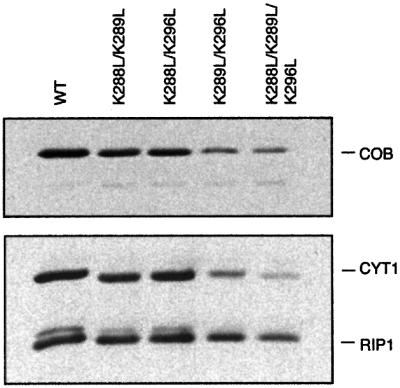
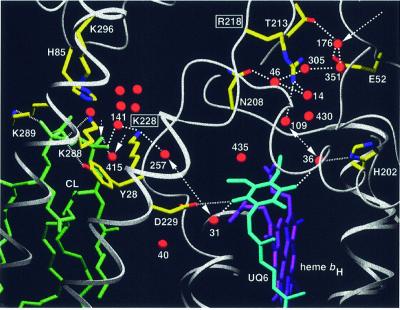
Biochemical data have shown that specific, tightly bound phospholipids are essential for activity of the cytochrome bc1 complex (QCR), an integral membrane protein of the respiratory chain. However, the structure and function of such phospholipids are not yet known. Here we describe five phospholipid molecules and one detergent molecule in the X-ray structure of yeast QCR at 2.3 A resolution. Their individual binding sites suggest specific roles in facilitating structural and functional integrity of the enzyme. Interestingly, a phosphatidylinositol molecule is bound in an unusual interhelical position near the flexible linker region of the Rieske iron-sulfur protein. Two possible proton uptake pathways at the ubiquinone reduction site have been identified: the E/R and the CL/K pathway. Remarkably, cardiolipin is positioned at the entrance to the latter. We propose that cardiolipin ensures structural integrity of the proton-conducting protein environment and takes part directly in proton uptake. Site-directed mutagenesis of ligating residues confirmed the importance of the phosphatidylinositol- and cardiolipin-binding sites.


Figures

None
Fig. 1. Binding of lipid molecules (L1–L5) and one detergent molecule (UM) to the yeast QCR. (A) View of the homodimeric QCR parallel to the membrane plane with the intermembrane space at the top and the matrix side at the bottom. The molecule is shown in a surface representation colored according to the electrostatic potential, with positive and negative charges in blue and red, respectively. Arrows indicate the regions of bound phospholipids and detergent, which are presented as stick models. The relative orientation of the inner mitochondrial membrane is depicted in yellow. It was determined by analysis of the percentage of solvent-exposed carbon atoms (orange) and of the number of water molecules (blue) in segments along the dimer axis. The relative positions of the heme cofactors (c1, bL and bH) and the iron–sulfur cluster (2Fe–2S) as well as of ubiquinone bound at the Qi site (UQ6) and stigmatellin bound at the Qo site (Stig) are indicated. (B) Binding of phospholipids (yellow) and detergent (yellow) in the transmembrane region of QCR viewed from the matrix side on the membrane plane. The core of the dimeric complex is made up of eight helices of COB (red) per monomer. Single helices of RIP1 (green), CYT1 (yellow), QCR8 (purple) and QCR9 (gray) are attached on each side at the periphery. The heme b cofactors (light gray) as well as UQ6 and Stig (dark gray) are shown. The helices are depicted as ribbon drawings, and further molecules as ball-and-stick representation. Standard colors are used for all non-carbon atoms.
None
Fig. 2. Binding interactions between the individual phospholipids, detergent and stabilizing amino acid residues: (A) detergent (UM), (B) L1 (PC), (C) L2 (PE), (D) L3 (PI), (E) L4 (PE) and (F) L5 (CL). Apparent hydrogen bonds are indicated with black lines, and hydrophobic interactions with green semi-circles (see Materials and methods). Molecules are shown in ball-and-stick presentation using standard colors. They have been rearranged for clarity after flattening to a two-dimensional plane.
None
Fig. 3. Close packing of the interhelical phospholipid L3 (PI) between the transmembrane helices of the catalytic subunits COB, CYT1 and RIP1. The phospholipid molecule, the trace of α-carbon atoms of the polypeptide chains as well as the side chain of Lys272 of CYT1 are shown. The latter forms an ion pair with the phosphodiester group of PI. The 2Fo – Fc electron density map (blue–gray) is contoured at 1.0σ. Molecules are shown in stick presentation.
None
Fig. 4. Western blot analysis after SDS–PAGE separation of mitochondrial membranes (20 µg) and isolated QCR (2 pmol) from yeasts expressing wild-type and mutated CYT1 (K272A). K272 is the stabilizing ligand of the interhelical phospholipid (L3). RIP1, COB and CYT1 were detected using specific antibodies.
None
Fig. 5. Section of the yeast QCR model showing L5 (cardiolipin), neighboring amino acid residues and water molecules. Hydrogen bonds or ion pairs with the oxygen atoms of the phosphodiester groups A and B of the cardiolipin headgroup are indicated as dashed lines (Lys288, Lys289 of CYT1, Tyr28 of COB). Water molecules are shown as balls, and other molecules in stick presentation. The final 2Fo – Fc electron density map (blue–gray) is contoured at 1.0σ. Atoms are shown in standard colors.
None
Fig. 6. Western blot analysis after SDS–PAGE separation of mitochondrial membranes (20 µg) from yeasts expressing wild-type or double and triple mutants of CYT1. Residues ligating the L5 (CL) phosphodiester group A have been mutated: (K288L/K289L, K288L/K296L, K289L/K296L and K288L/K289L/K296L). RIP1, COB and CYT1 were detected using specific antibodies.
None
Fig. 7. Putative proton uptake pathways at the Qi site of yeast QCR via two arrays of hydrogen-bonded water molecules, which connect the bulk solvent at the matrix side with the site of ubiquinone reduction. The entrance to the E/R pathway is formed by Glu52 of QCR7 and Wat176. The gating residue towards the quinone-binding pocket is Arg218 of COB. Cardiolipin (L5) is positioned at the entrance to the CL/K pathway, for which Lys228 of COB is the gating residue. Arrows indicate the access sites from the bulk solvent, and double arrows show proton transfer between the key residues Arg218 or Lys228 of COB and UQ6. Side chains of amino acid residues that are involved in hydrogen bond interactions or ion pair formation are shown (standard colors). Dashed lines indicate hydrogen bond interactions. Dotted lines are used for hydrogen bond interactions of UQ6 and CL ligands (His202, Asp229 and Tyr28 of COB, and Lys288 and Lys289 of CYT1). Water molecules in the cavity above the cardiolipin headgroup are stabilized by interactions with side chains of Lys228 of COB, Lys296 of CYT1 and His85 of QCR7. A surrounding layer of non-polar residues (not shown) encloses the water-filled cavity. Transmembrane helices are shown as ribbon presentation and other polypeptide backbones as rope presentation. UQ6, heme bH and CL are represented as stick models.

References

    1. Berry E.A., Zhang,Z., Huang,L.S. and Kim,S.H. (1999) Structures of quinone-binding sites in bc complexes: functional implications. Biochem. Soc. Trans., 27, 565–572. - PubMed
    1. Berry E.A., Guergova-Kuras,M., Huang,L. and Crofts,A.R. (2000) Structure and function of cytochrome bc complexes. Annu. Rev. Biochem., 69, 1005–1075. - PubMed
    1. Beyer K. and Nuscher,B. (1996) Specific cardiolipin binding interferes with labeling of sulfhydryl residues in the adenosine diphosphate/adenosine triphosphate carrier protein from beef heart mitochondria. Biochemistry, 35, 15784–15790. - PubMed
    1. Brandt U. and Trumpower,B.L. (1994) The protonmotive Q cycle in mitochondria and bacteria. Crit. Rev. Biochem. Mol. Biol., 29, 165–197. - PubMed
    1. Brandt U., Uribe,S., Schägger,H. and Trumpower,B.L. (1994) Isolation and characterization of QCR10, the nuclear gene encoding the 8.5-kDa subunit 10 of the Saccharomyces cerevisiae cytochrome bc1 complex. J. Biol. Chem., 269, 12947–12953. - PubMed

Publication types

MeSH terms