

Evolutionary history of Cer elements and their impact on the C. elegans genome
- PMID: 11731497
- PMCID: PMC311226
- DOI: 10.1101/gr.196201
Evolutionary history of Cer elements and their impact on the C. elegans genome
Abstract
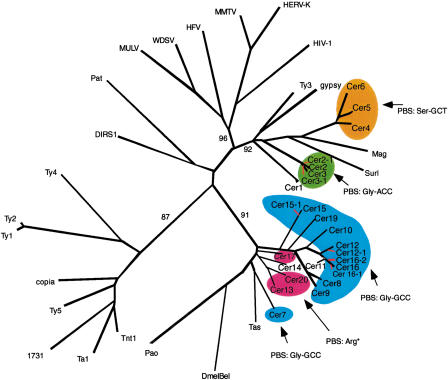
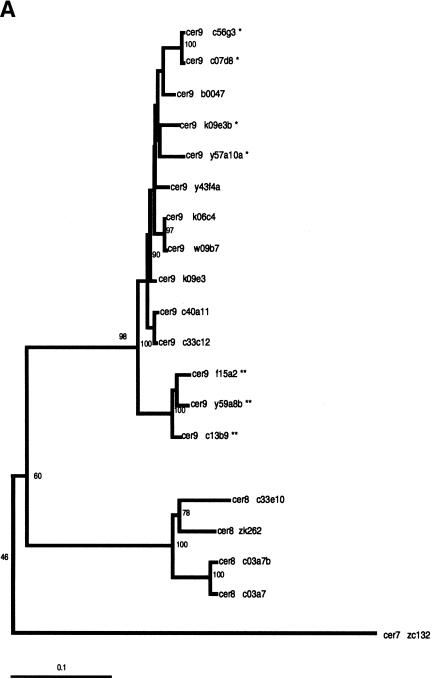
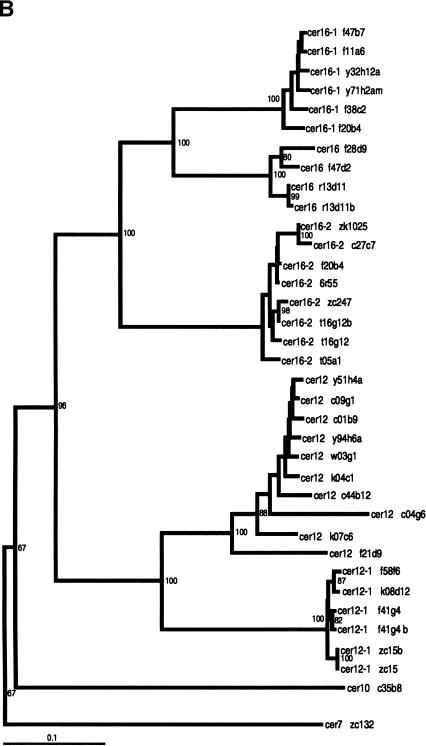
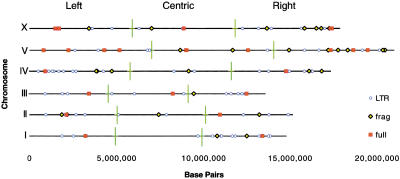
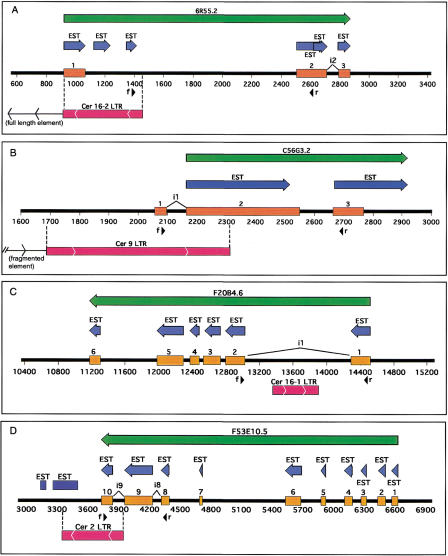
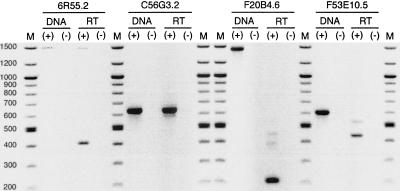
We report the results of sequence analysis and chromosomal distribution of all distinguishable long terminal repeat (LTR) retrotransposons (Cer elements) in the Caenorhabditis elegans genome. Included in this analysis are all readily recognizable full-length and fragmented elements, as well as solo LTRs. Our results indicate that there are 19 families of Cer elements, some of which display significant subfamily structure. Cer elements can be clustered based on their tRNA primer binding sites (PBSs). These clusters are in concordance with our reverse transcriptase- and LTR-based phylogenies. Although we find that most Cer elements are located in the gene depauperate chromosome ends, some elements are located in or near putative genes and may contribute to gene structure and function. The results of RT-PCR analyses are consistent with this prediction.
Figures
Similar articles
-
Evolutionary history of Oryza sativa LTR retrotransposons: a preliminary survey of the rice genome sequences.BMC Genomics. 2004 Mar 2;5(1):18. doi: 10.1186/1471-2164-5-18. BMC Genomics. 2004. PMID: 15040813 Free PMC article.
-
Retrotransposons and their recognition of pol II promoters: a comprehensive survey of the transposable elements from the complete genome sequence of Schizosaccharomyces pombe.Genome Res. 2003 Sep;13(9):1984-97. doi: 10.1101/gr.1191603. Genome Res. 2003. PMID: 12952871 Free PMC article.
-
De novo identification of LTR retrotransposons in eukaryotic genomes.BMC Genomics. 2007 Apr 3;8:90. doi: 10.1186/1471-2164-8-90. BMC Genomics. 2007. PMID: 17407597 Free PMC article.
-
Becoming a Selfish Clan: Recombination Associated to Reverse-Transcription in LTR Retrotransposons.Genome Biol Evol. 2019 Dec 1;11(12):3382-3392. doi: 10.1093/gbe/evz255. Genome Biol Evol. 2019. PMID: 31755923 Free PMC article. Review.
-
Co-evolution of plant LTR-retrotransposons and their host genomes.Protein Cell. 2013 Jul;4(7):493-501. doi: 10.1007/s13238-013-3037-6. Epub 2013 Jun 23. Protein Cell. 2013. PMID: 23794032 Free PMC article. Review.
Cited by
-
Continuous exchange of sequence information between dispersed Tc1 transposons in the Caenorhabditis elegans genome.Genetics. 2003 May;164(1):127-34. doi: 10.1093/genetics/164.1.127. Genetics. 2003. PMID: 12750326 Free PMC article.
-
Evolutionary history of Oryza sativa LTR retrotransposons: a preliminary survey of the rice genome sequences.BMC Genomics. 2004 Mar 2;5(1):18. doi: 10.1186/1471-2164-5-18. BMC Genomics. 2004. PMID: 15040813 Free PMC article.
-
Retrotransposons and their recognition of pol II promoters: a comprehensive survey of the transposable elements from the complete genome sequence of Schizosaccharomyces pombe.Genome Res. 2003 Sep;13(9):1984-97. doi: 10.1101/gr.1191603. Genome Res. 2003. PMID: 12952871 Free PMC article.
-
Translational recoding signals between gag and pol in diverse LTR retrotransposons.RNA. 2003 Dec;9(12):1422-30. doi: 10.1261/rna.5105503. RNA. 2003. PMID: 14623998 Free PMC article.
-
Molecular basis of the copulatory plug polymorphism in Caenorhabditis elegans.Nature. 2008 Aug 21;454(7207):1019-22. doi: 10.1038/nature07171. Epub 2008 Jul 16. Nature. 2008. PMID: 18633349 Free PMC article.
References
-
- Banki K, Halladay D, Perl A. Cloning and expression of the human gene for transaldolase. A novel highly repetitive element constitutes an integral part of the coding sequence. J Biol Chem. 1994;269:2847–2851. - PubMed
-
- Berg DE, Howe MM. Mobile DNA. Washington, DC.: American Society for Microbiology; 1989.
-
- Bowen NJ, McDonald JF. Genomic analysis of Caenorhabditis elegans reveals ancient families of retroviral-like elements. Genome Res. 1999;9:924–935. - PubMed
Publication types
MeSH terms
Substances
LinkOut - more resources
Full Text Sources
Other Literature Sources