. 2001 Dec 1;537(Pt 2):407-20.
doi: 10.1111/j.1469-7793.2001.00407.x.

Mathematical modelling of non-stationary fluctuation analysis for studying channel properties of synaptic AMPA receptors

Affiliations

Mathematical modelling of non-stationary fluctuation analysis for studying channel properties of synaptic AMPA receptors

T A Benke et al. J Physiol. .

Abstract

1. The molecular properties of synaptic alpha-amino-3-hydroxy-5-methyl-4-isoxazolepropionate (AMPA) receptors are an important factor determining excitatory synaptic transmission in the brain. Changes in the number (N) or single-channel conductance (gamma) of functional AMPA receptors may underlie synaptic plasticity, such as long-term potentiation (LTP) and long-term depression (LTD). These parameters have been estimated using non-stationary fluctuation analysis (NSFA). 2. The validity of NSFA for studying the channel properties of synaptic AMPA receptors was assessed using a cable model with dendritic spines and a microscopic kinetic description of AMPA receptors. Electrotonic, geometric and kinetic parameters were altered in order to determine their effects on estimates of the underlying gamma. 3. Estimates of gamma were very sensitive to the access resistance of the recording (R(A)) and the mean open time of AMPA channels. Estimates of gamma were less sensitive to the distance between the electrode and the synaptic site, the electrotonic properties of dendritic structures, recording electrode capacitance and background noise. Estimates of gamma were insensitive to changes in spine morphology, synaptic glutamate concentration and the peak open probability (P(o)) of AMPA receptors. 4. The results obtained using the model agree with biological data, obtained from 91 dendritic recordings from rat CA1 pyramidal cells. A correlation analysis showed that R(A) resulted in a slowing of the decay time constant of excitatory postsynaptic currents (EPSCs) by approximately 150 %, from an estimated value of 3.1 ms. R(A) also greatly attenuated the absolute estimate of gamma by approximately 50-70 %. 5. When other parameters remain constant, the model demonstrates that NSFA of dendritic recordings can readily discriminate between changes in gamma vs. changes in N or P(o). Neither background noise nor asynchronous activation of multiple synapses prevented reliable discrimination between changes in gamma and changes in either N or P(o). 6. The model (available online) can be used to predict how changes in the different properties of AMPA receptors may influence synaptic transmission and plasticity.


Figures

Figure 1
Figure 1. The compartmental model used for non-stationary fluctuation analysis estimates of γ
A, the 25-compartment model. B, the spine with seven compartments, enlarged for detail. The spine head diameter is 0.55 μm and its length is 0.45 μm. The spine shaft diameter is 0.1 μm and its length is 0.68 μm. End-dendritic regions have enlarged diameters to explicitly model fine branches. Variable electrode positions are indicated by the arrows in A. The location of the dendritic spine is marked by the asterisk in A. For distal electrode placement, the distal dendrite was further divided into smaller compartments (not shown). C, equivalent circuit model of the electrode, dendritic segment, spine and synapse with elements of the access resistance (RA) connected to the amplifier command voltage (Vamp), membrane capacitance (Cm), pipette capacitance (Cpip), internal resistivity (Ri) and membrane resistivity (Rm).
Figure 2
Figure 2. Macroscopic AMPA receptor kinetic scheme and simulated excitatory postsynaptic currents (simEPSCs)
A, kinetic scheme with rate constants as in Jonas et al. (1993) except β and α as noted in the text. B, simulation of 40 AMPA receptor channels (N) in response to a glutamate pulse under voltage-clamp conditions shows that the membrane current at the synaptic site (thin trace) is filtered by the combined electrode-dendritic structure when recorded by the patch electrode attached to the dendrite near the spine neck (thick trace). The inset shows scaled currents to demonstrate the faster time course of the synaptic current compared to the electrode current (standard conditions used).
Figure 3
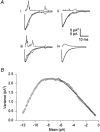
Figure 3. Non-stationary fluctuation analysis of simEPSCs
Ai-iii, squared difference currents (top traces) were obtained by subtracting individual simEPSCs (bottom thin traces) from the peak-scaled mean current (bottom thick traces); iv, mean squared difference current (top trace) and mean simEPSC (bottom trace) for the data set. B, variance-mean amplitude plot obtained from 1000 simEPSCs. These data were fitted to σ2=iI - I2/N+bl between 0 and 50 % peak amplitude (r2= 0.989).
Figure 4
Figure 4. Effects of Rm, Cm and Ri on estimates of γ
This graph illustrates the effects of changes in electrotonic parameters on the estimates of γ. The x-axis plots the pulse index, defined as the squared difference between the current responses to a -1 mV voltage step, for a model with constant values for Rm (77 kΩ cm2), Ri (290 Ω cm) and Cm (0.65 μF cm−2) and a model in which these parameters are modified (Rm= 38-154 kΩ cm2, Ri= 100-294 Ω cm, Cm= 0.65-1 μF cm−2) in various combinations. In addition, RA (circles = 20 MΩ, squares and triangles = 35 MΩ) and the distance of the electrode from the synapse (squares and circles = 0.5 μm; triangles = 16 μm) were varied. The y-axis plots the larger γ estimate as a ratio of the smaller γ estimate (γ ratio). Coloured symbols correspond to the traces illustrated on the right.
Figure 5
Figure 5. Effects of Gaussian noise on estimates of γ
A, progressively more Gaussian noise was added to simEPSCs (root mean square values); 0 pA (i), 0.5 pA (ii), 1 pA (iii), 1.5 pA (iv), 2 pA (v) and 2.5 pA (vi). B, current-variance plots obtained from the same ensemble of simEPSCs with increasing noise. C, additional error in estimate of γ introduced by Gaussian noise (% error = 100(γno noise - γadded noise)/γno noise).
Figure 6
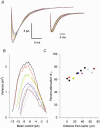
Figure 6. Effects of electrode distance from the synapse on estimates of γ
A, mean simEPSCs obtained with successively increasing proximal distance of the electrode from the spine from 0.5 μm (black, electrode at the spine) to 70 μm (brown, electrode on the soma) under otherwise standard conditions. The inset shows corresponding peak scaled currents. B, current-variance plots for the data shown in A. C, the attenuation of the estimated γ compared to input γ (16 pS) plotted vs. distance of the electrode from the spine. A gradual progressive attenuation in estimates of γ is shown as the electrode is moved proximally from the spine towards the soma (circles) and distally from the spine away from the soma (squares; attenuation of γ (%) = 100(γinput - γestimated)/γinput).
Figure 7
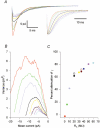
Figure 7. RA affects estimates of γ
A, mean simEPSCs obtained with increasing values of RA from 0.5 MΩ (red) to 60 MΩ (light blue). The black trace represents standard conditions with an RA of 20 MΩ. The inset shows peak scaled simEPSCs. B, current- variance plots for the data shown in A. C, attenuation of the estimated γ compared to input γ (16 pS) plotted vs. input RA (per cent attenuation calculated as for Fig. 6C). The open circles at 20 and 35 MΩ correspond to an added Cpip of 10 pF.
Figure 8
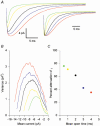
Figure 8. Mean open time affects estimates of γ
A, mean simEPSCs obtained with increasing mean open times from 0.5 ms (green) to 4 ms (red). The inset shows peak scaled simEPSCs. B, current- variance plots for the data in A. C, attenuation of the estimated γ compared to input γ (16 pS) plotted vs. mean open time (per cent attenuation calculated as for Fig. 6C).
Figure 9
Figure 9. Correlation analysis of experimentally measured values of RA with estimates of τdecay and γ
A, plot of estimated τdecayvs. experimentally determined RA for 91 experiments, fitted by linear regression (black circles and line; r2= 0.60, P < 5 × 10⁻⁹). The y-intercept predicts a τdecay value of 3.1 ms for an RA of 0 MΩ (mean τdecay= 7.8 ± 0.3 ms; n = 91). Red circles show τdecay calculated from the model-generated simEPSCs of Fig. 7A, and fitted by linear regression (red line; y-intercept predicts a τdecay value of 3.1 ms for an access resistance of 0 MΩ). B, plot of estimated γvs. RA (black circles; mean γ= 5.4 ± 0.3 pS; n = 91). Red circles show model data re-plotted from Fig. 7C, and fitted by a single exponential (red line).
Figure 10
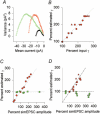
Figure 10. Non-stationary fluctuation analysis distinguishes changes in N and the peak open probability (Po) from changes in γ
A, peak-scaled NSFA of 500 simEPSCs (under otherwise standard conditions) resulting from different input N or γ: 40 channels with 16 pS (black), 160 channels with 16 pS (green), 40 channels with 32 pS (red). Smooth curves are fits (0-50 %) of the parabolic equation giving estimated channel conductances of 6.1, 6.1 and 13.5 pS, respectively. B, increases in the input channel γ (from 16 to 40 pS as a percentage of the input baseline value of 16 pS) are paralleled by increases in the estimated channel γ (expressed as a percentage of baseline estimated γ) under varying electrotonic conditions: Ri= 294 Ω cm, RA= 20 MΩ, with the electrode 0.5 μm from the synapse (circles); Ri= 294 Ω cm, RA= 35 MΩ, with the electrode 0.5 μm from the synapse (squares); Ri= 294 Ω cm, RA= 35 MΩ, with the electrode 16 μm from the synapse (triangles); Ri= 100 Ω cm, RA= 35 MΩ, electrode 16 μm from the synapse (inverted triangles). The dotted line represents a 1:1 ratio. C, increases in the estimated channel γ (generated by increases in the input γ from 2 to 40 pS) are paralleled by increases in the size of mean simEPSC amplitude (red circles). Changes not related to γ affect simEPSC amplitude but not estimated γ; changes in Po (0.31, 0.46, 0.53, 0.74 and 0.80 compared to 0.53; green circles), changes in N (20, 40, 80 and 160 channels compared to 40 channels; green squares). D, a similar relationship holds with 2.5 pA peak-to-peak added Gaussian noise (RA= 35 MΩ; distance of the electrode from the synapse: circles 16 μm distal, squares 26 μm distal, triangles 16 μm proximal, inverted triangles 26 μm proximal; otherwise standard conditions). Increases in the estimated channel γ (generated by increases in the input γ from 16 to 40 pS, red symbols) are paralleled by increases in the size of the mean simEPSC peak amplitude. Increases in N (from 20 to 160, green symbols) increased simEPSC peak amplitude but not estimated γ.
Figure 11
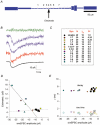
Figure 11. Effects of asynchronous release from multiple synapses on estimates of γ
A, the original model was expanded to 83 compartments with 7 dendritic spines (1-7, modelled as in Fig. 1B) with asynchronous synaptic activation (as detailed in the text) and 2.5 pA peak-to-peak added Gaussian noise. B, with all synapses releasing (Pr= 0.5 at each synapse), four example traces are shown: synaptic failure (green), asynchronous responses (blue) and fast monophasic traces (red). Only traces such as the red traces were used for analysis to give the mean simEPSC (black trace). C, the range of parameters tested. Syn refers to the numbering of the active synapses (1-7). D, plot of estimated γvs. mean simEPSC peak amplitude for these conditions. The dashed line is a regression line (slope = -0.7, r2= 0.96) for all synapses active, with Pr= 0.5 for γin= 16, 24, 32 and 40 pS. The dotted line is also a regression line (slope = 0.03, r2= 0.15) for all other conditions with γin= 16 pS. E, plot of τrise and τdecayvs. mean simEPSC peak amplitude for these conditions.

References

    1. Benke TA, Lüthi A, Isaac JTR, Collingridge GL. Modulation of AMPA receptor unitary conductance by synaptic activity. Nature. 1998;395:793–797. - PubMed
    1. Bliss T, Collingridge G. A synaptic model of memory: long-term potentiation in the hippocampus. Nature. 1993;361:31–39. - PubMed
    1. Burden RL, Faires JD. Numerical Analysis. PWS, Boston: 1985. Interpolation and polynomial approximation; pp. 78–135.
    1. Choi S, Klingauf J, Tsien RW. Postfusional regulation of cleft glutamate concentration during LTP at ‘silent synapses’. Nature Neuroscience. 2000;3:330–336. - PubMed
    1. Clay JR, DeFelice LJ. Relationship between membrane excitability and single channel open-close kinetics. Biophysical Journal. 1983;42:151–157. - PMC - PubMed

Publication types

LinkOut - more resources