. 2001 Dec 1;537(Pt 2):651-6.
doi: 10.1111/j.1469-7793.2001.00651.x.

Suppression of EMG activity by transcranial magnetic stimulation in human subjects during walking

Affiliations

Suppression of EMG activity by transcranial magnetic stimulation in human subjects during walking

N T Petersen et al. J Physiol. .

Abstract

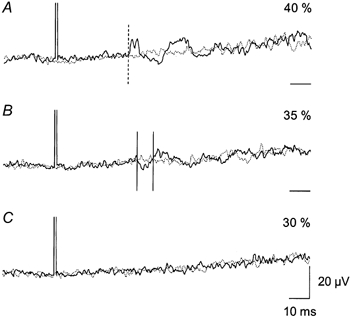
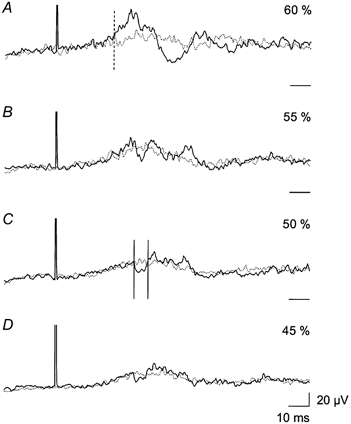
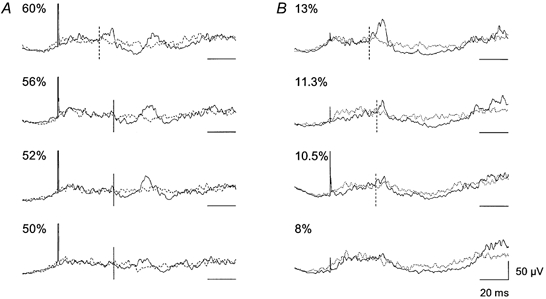
1. The involvement of the motor cortex during human walking was evaluated using transcranial magnetic stimulation (TMS) of the motor cortex at a variety of intensities. Recordings of EMG activity in tibialis anterior (TA) and soleus muscles during walking were rectified and averaged. 2. TMS of low intensity (below threshold for a motor-evoked potential, MEP) produced a suppression of ongoing EMG activity during walking. The average latency for this suppression was 40.0 +/- 1.0 ms. At slightly higher intensities of stimulation there was a facilitation of the EMG activity with an average latency of 29.5 +/- 1.0 ms. As the intensity of the stimulation was increased the facilitation increased in size and eventually a MEP was clear in individual sweeps. 3. In three subjects TMS was replaced by electrical stimulation over the motor cortex. Just below MEP threshold there was a clear facilitation at short latency (approximately 28 ms). As the intensity of the electrical stimulation was reduced the size of the facilitation decreased until it eventually disappeared. We did not observe a suppression of the EMG activity similar to that produced by TMS in any of the subjects. 4. The present study demonstrates that motoneuronal activity during walking can be suppressed by activation of intracortical inhibitory circuits. This illustrates for the first time that activity in the motor cortex is directly involved in the control of the muscles during human walking.


Figures

Figure 2
Figure 2. The effect of TMS on soleus EMG activity during walking
Same set-up as in Fig. 1. Each trace is the average of 150 sweeps of the rectified soleus EMG activity triggered 300 ms after heel contact. Continuous lines are EMG activity with magnetic stimulation and dotted lines are EMG activity without magnetic stimulation. The intensity of the magnetic stimulation is expressed as a percentage of maximum stimulator output: A, 40 %; B, 35 %; and C, 30 %. The MEP threshold was 50 % maximum stimulator output. The onset of facilitation is indicated in A by the vertical dashed line. The time window for measurement of the suppression is illustrated by the two vertical continuous lines in B. Time scale bars indicate the baseline (0 μV) for each trace.
Figure 1
Figure 1. The effect of TMS on TA EMG activity during walking
Each trace is an average of 200 sweeps of the rectified EMG activity in the TA. The average was triggered from the magnetic stimulus and obtained in the early part of the swing phase (700 ms after heel contact). Two traces are superimposed; the continuous line is the average of sweeps with magnetic stimulation, whilst the dotted line is the average EMG activity without stimulation. Sweeps with and without magnetic stimulation were sampled randomly. Four different intensities of magnetic stimulation were used (expressed as a percentage of the maximum stimulator output): A, 60 %; B, 55 %; C, 50 %; and D, 45 %. The vertical dashed line in A shows the onset of the facilitation. The vertical continuous lines in C indicate the onset and end of the suppression; this time window was used for quantification of the amount of suppression. The threshold for evoking a MEP in this subject was 65 %. Horizontal time scale bars on the right indicate the baseline (0 μV) for each trace.
Figure 3
Figure 3. The effect of TMS vs. electrical transcranial stimulation on TA EMG activity during walking
Continuous lines represent averages of sweeps (n = 100) with stimulation; TMS in A and transcranial electrical stimulation in B. Dotted lines represent averages (n = 100) of background EMG activity. The intensity of the stimulation as a percentage of the maximum stimulator output is indicated for each trace. Horizontal scale bars indicate the baseline level (0 μV) for each trace. The vertical dashed lines show the onset of the facilitation and the vertical continuous lines show the onset of the suppression.

References

    1. Brouwer B, Ashby P. Corticospinal projections to lower limb motoneurons in man. Experimental Brain Research. 1992;89:649–654. - PubMed
    1. Burke D, Hicks R, Gandevia SC, Stephen J, Woodforth I, Crawford M. Direct comparison of corticospinal volleys in human subjects to transcranial magnetic and electrical stimulation. Journal of Physiology. 1993;470:383–393. - PMC - PubMed
    1. Capaday C, Lavoie BA, Barbeau H, Schneider C, Bonnard M. Studies on the corticospinal control of human walking. I. Responses to focal transcranial magnetic stimulation of the motor cortex. Journal of Neurophysiology. 1999;81:129–139. - PubMed
    1. Davey NJ, Romaiguere P, Maskill DW, Ellaway PH. Suppression of voluntary motor activity revealed using transcranial magnetic stimulation of the motor cortex in man. Journal of Physiology. 1994;477:223–235. - PMC - PubMed
    1. Di Lazarro V, Oliviero A, Profice P, Saturno E, Pilato F, Insola A, Mazzone P, Tonali P, Rothwell JC. Comparison of descending volleys evoked by transcranial magnetic and electric stimulation in conscious humans. Electroencephalography and Clinical Neurophysiology. 1998a;109:397–401. - PubMed

Publication types

LinkOut - more resources