

Nucleotide diversity and haplotype structure of the human angiotensinogen gene in two populations
- PMID: 11731937
- PMCID: PMC384882
- DOI: 10.1086/338454
Nucleotide diversity and haplotype structure of the human angiotensinogen gene in two populations
Abstract
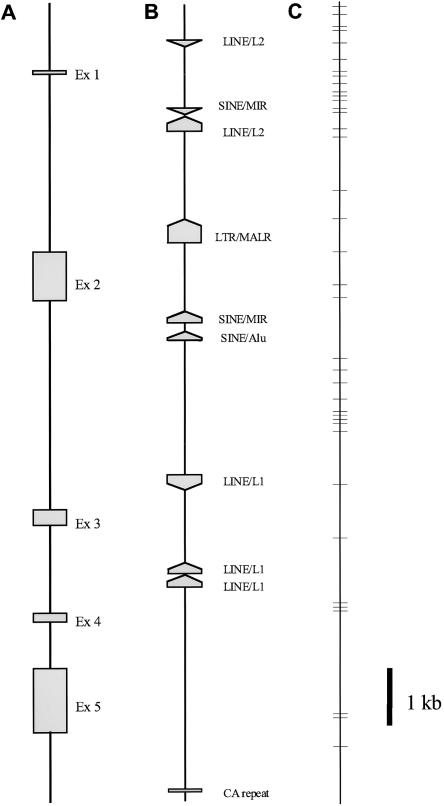
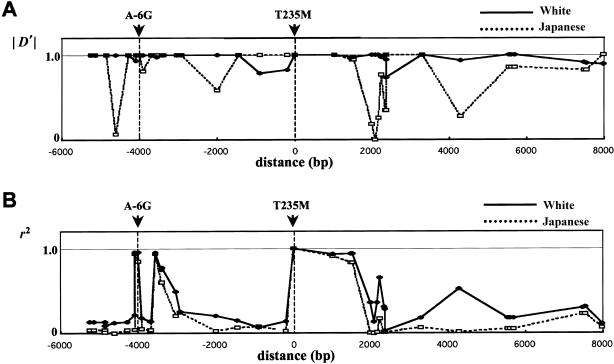
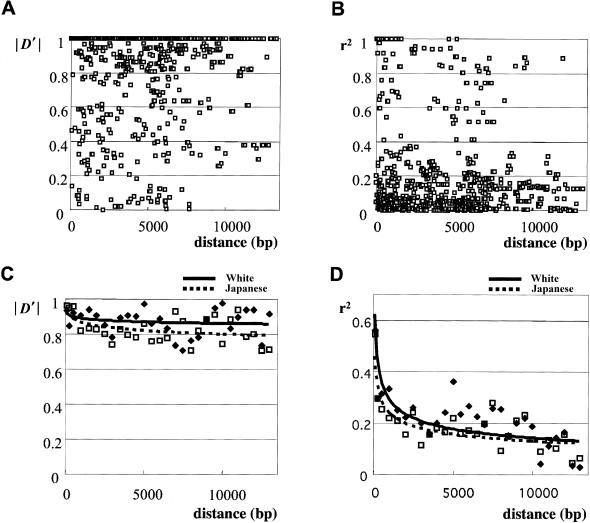
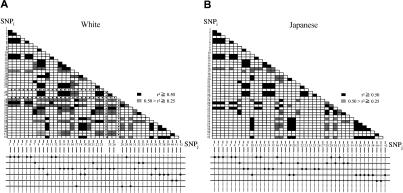
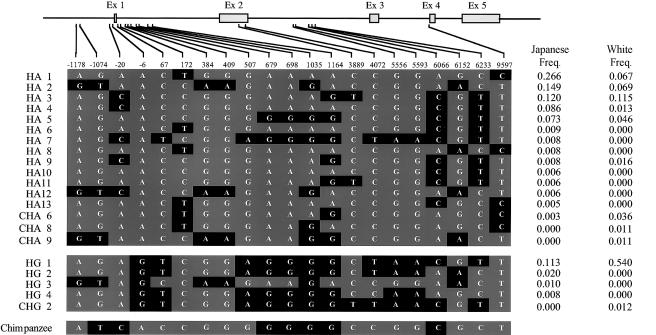
Variation in the angiotensinogen gene, AGT, has been associated with variation in plasma angiotensinogen levels. In addition, the T235M polymorphism in the AGT product is associated with an increased risk of essential hypertension in multiple populations, making AGT a good example of a quantitative-trait locus underlying susceptibility to a common disease. To better understand genetic variation in AGT, we sequenced a 14.4-kb genomic region spanning the entire AGT and identified 44 single-nucleotide polymorphisms (SNPs). Forty-two SNPs were observed both in 88 white and in 77 Japanese unselected subjects. Six major haplotypes accounted for most of the variation in this region, indicating less allelic complexity than in many other genomic regions. Although the two populations were found to share all of the major AGT haplotypes, there were substantial differences in haplotype frequencies. Pairwise linkage disequilibrium (LD), measured by the D', r(2), and d(2) statistics, demonstrated a general pattern of decline with increasing distance, but, as expected in a small genomic region, individual LD values were highly variable. LD between T235M and each of the other 39 SNPs was assessed in order to model the usefulness of LD to detect a disease-associated mutation. Among the Japanese subjects, 13 (33%) of the SNPs had r(2) values >0.1, whereas this statistic was substantially higher for the white subjects (occurring in 35/39 [90%]). LD between a hypertension-associated promoter mutation, A-6G, and 39 SNPs was also measured. Similar results were obtained, with 33% of the SNPs showing r(2)>0.1 in the Japanese subjects and 92% of the SNPs showing r(2)>0.1 in the white subjects. This difference, which occurs despite an overall similarity in LD patterns in the two populations, reflects a much higher frequency of the M235-associated haplotype in the white sample. These results have important implications for the usefulness of LD approaches in the mapping of genes underlying susceptibility to complex diseases.
Figures
Comment in
-
SNPs at the 3' end of the angiotensinogen gene define two haplotypes associated with the common 235Met variant.Am J Hum Genet. 2002 Aug;71(2):443-4. doi: 10.1086/341721. Am J Hum Genet. 2002. PMID: 12154781 Free PMC article. No abstract available.
Similar articles
-
Patterns of genetic variation in the hypertension candidate gene GRK4: ethnic variation and haplotype structure.Ann Hum Genet. 2006 Jan;70(Pt 1):27-41. doi: 10.1111/j.1529-8817.2005.00197.x. Ann Hum Genet. 2006. PMID: 16441255
-
Linkage disequilibrium and haplotype diversity in the genes of the renin-angiotensin system: findings from the family blood pressure program.Genome Res. 2003 Feb;13(2):173-81. doi: 10.1101/gr.302003. Genome Res. 2003. PMID: 12566395 Free PMC article.
-
Haplotype and linkage disequilibrium architecture for human cancer-associated genes.Genome Res. 2002 Dec;12(12):1846-53. doi: 10.1101/gr.483802. Genome Res. 2002. PMID: 12466288 Free PMC article.
-
On selecting markers for association studies: patterns of linkage disequilibrium between two and three diallelic loci.Genet Epidemiol. 2003 Jan;24(1):57-67. doi: 10.1002/gepi.10217. Genet Epidemiol. 2003. PMID: 12508256 Review.
-
Characterizing linkage disequilibrium in pig populations.Int J Biol Sci. 2007 Feb 10;3(3):166-78. doi: 10.7150/ijbs.3.166. Int J Biol Sci. 2007. PMID: 17384735 Free PMC article. Review.
Cited by
-
Genetics of arterial hypertension and hypotension.Naunyn Schmiedebergs Arch Pharmacol. 2007 Feb;374(5-6):429-69. doi: 10.1007/s00210-007-0133-2. Epub 2007 Jan 30. Naunyn Schmiedebergs Arch Pharmacol. 2007. PMID: 17262198 Review.
-
Allele-specific expression of angiotensinogen in human subcutaneous adipose tissue.Hypertension. 2013 Jul;62(1):41-7. doi: 10.1161/HYPERTENSIONAHA.113.01330. Epub 2013 May 6. Hypertension. 2013. PMID: 23648704 Free PMC article.
-
Revising the M235T polymorphism position for the AGT gene and reporting a modifying variant in the Brazilian population with potential cardiac and neural impact.J Mol Neurosci. 2012 Sep;48(1):253-6. doi: 10.1007/s12031-012-9768-7. Epub 2012 Apr 25. J Mol Neurosci. 2012. PMID: 22531885
-
Disentangling fetal and maternal susceptibility for pre-eclampsia: a British multicenter candidate-gene study.Am J Hum Genet. 2005 Jul;77(1):127-31. doi: 10.1086/431245. Epub 2005 May 11. Am J Hum Genet. 2005. PMID: 15889386 Free PMC article.
-
Relationship between a Weighted Multi-Gene Algorithm and Blood Pressure Control in Hypertension.J Clin Med. 2019 Feb 28;8(3):289. doi: 10.3390/jcm8030289. J Clin Med. 2019. PMID: 30823438 Free PMC article.
References
Electronic-Database Information
-
- ARLEQUIN, http://anthropologie.unige.ch/arlequin (for the Arlequin program)
-
- GenBank Overview, http://www.ncbi.nlm.nih.gov/Genbank/GenbankOverview.html (for the sequence of AGT [accession numbers NM_000029 and X15323])
-
- Online Mendelian Inheritance in Man (OMIM), http://www.ncbi.nlm.nih.gov/Omim/ (for EHT [MIM 145500] and AGT [MIM 106150])
-
- RepeatMasker Documentation, http://ftp.genome.washington.edu/RM/RepeatMasker.html
-
- Topal web site, http://www.rdg.ac.uk/Statistics/genetics/software.html (for the Topal 2.0 package)
References
-
- Beaumont MA, Nichols RA (1999) Evaluating loci for use in the genetic analysis of population structure. Proc R Soc Lond B Biol Sci 263:1619–1626
-
- Bengtsson K, Orho-Melander M, Lindblad U, Melander O, Bog-Hansen E, Ranstam J, Rastam L, Groop L (1999) Polymorphism in the angiotensin converting enzyme but not in the angiotensinogen gene is associated with hypertension and type 2 diabetes: the Skaraborg Hypertension and Diabetes Project. J Hypertens 17:1569–1575 - PubMed
Publication types
MeSH terms
Substances
Grants and funding
LinkOut - more resources
Full Text Sources
Research Materials
Miscellaneous
