. 2001 Dec 10;155(6):979-90.
doi: 10.1083/jcb.200107028. Epub 2001 Dec 3.

A role for Vps1p, actin, and the Myo2p motor in peroxisome abundance and inheritance in Saccharomyces cerevisiae

Affiliations

A role for Vps1p, actin, and the Myo2p motor in peroxisome abundance and inheritance in Saccharomyces cerevisiae

D Hoepfner et al. J Cell Biol. .

Abstract

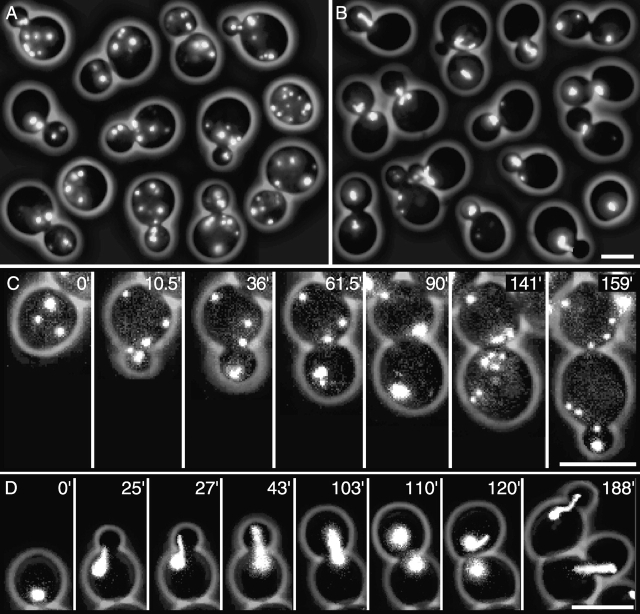
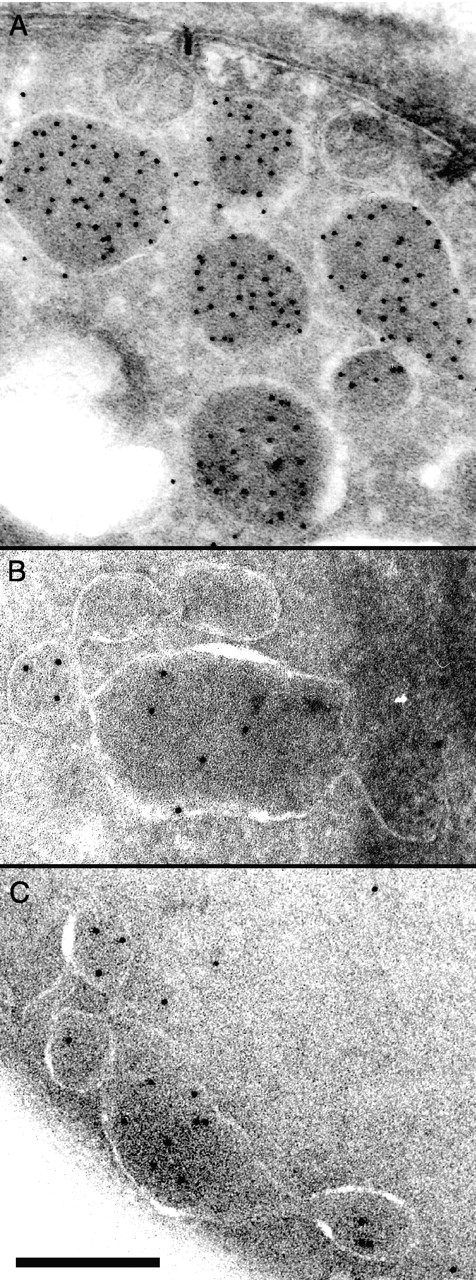
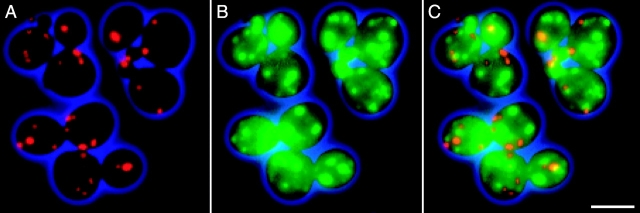
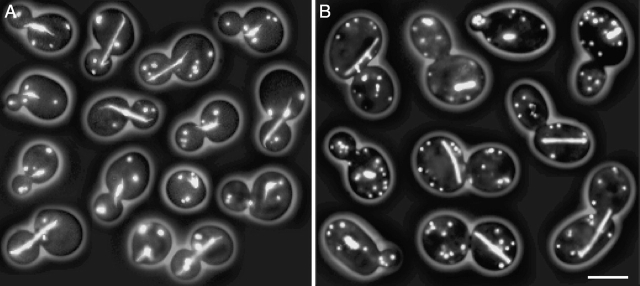
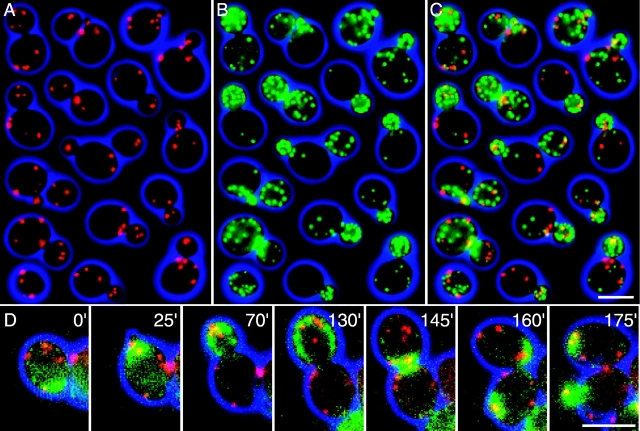
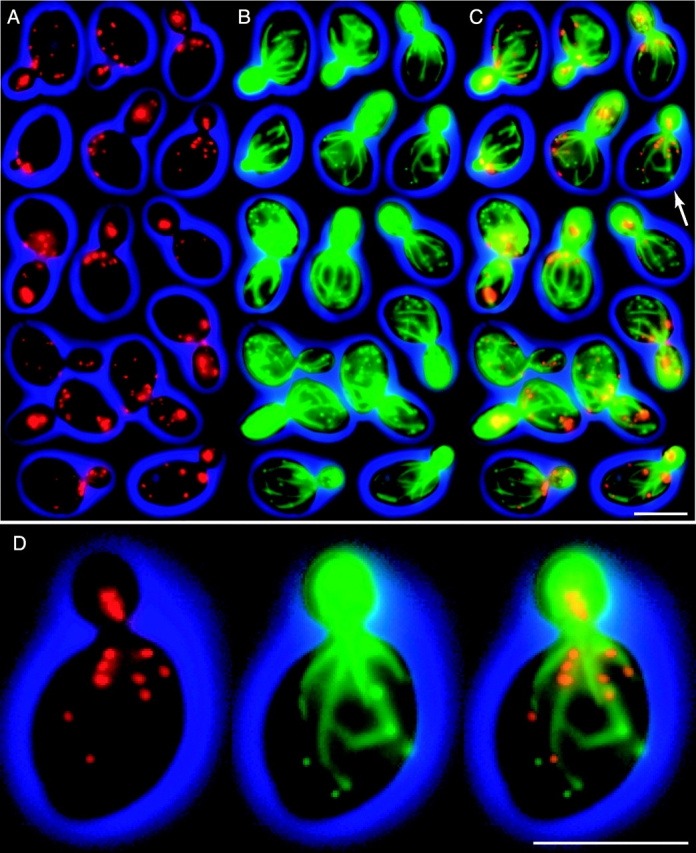
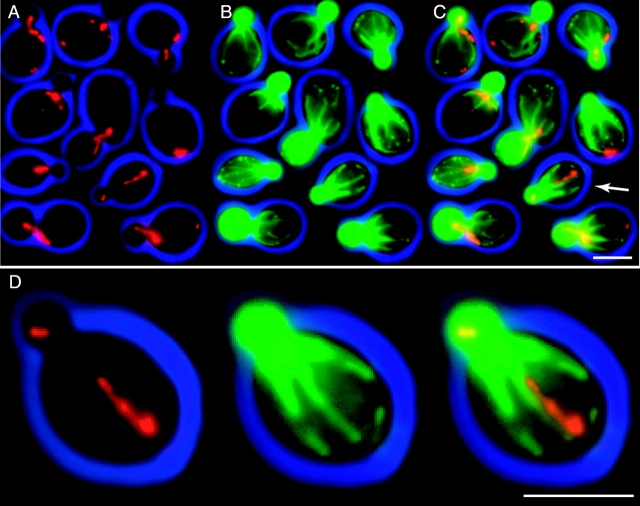
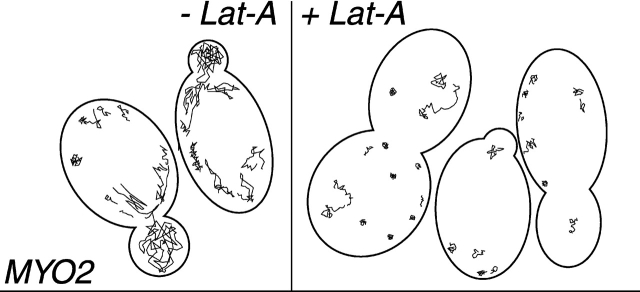
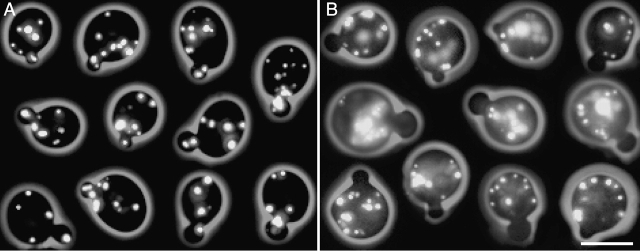
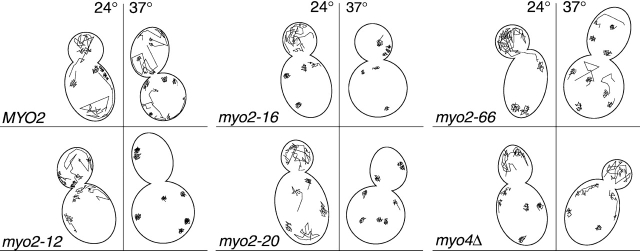
In vivo time-lapse microscopy reveals that the number of peroxisomes in Saccharomyces cerevisiae cells is fairly constant and that a subset of the organelles are targeted and segregated to the bud in a highly ordered, vectorial process. The dynamin-like protein Vps1p controls the number of peroxisomes, since in a vps1Delta mutant only one or two giant peroxisomes remain. Analogous to the function of other dynamin-related proteins, Vps1p may be involved in a membrane fission event that is required for the regulation of peroxisome abundance. We found that efficient segregation of peroxisomes from mother to bud is dependent on the actin cytoskeleton, and active movement of peroxisomes along actin filaments is driven by the class V myosin motor protein, Myo2p: (a) peroxisomal dynamics always paralleled the polarity of the actin cytoskeleton, (b) double labeling of peroxisomes and actin cables revealed a close association between both, (c) depolymerization of the actin cytoskeleton abolished all peroxisomal movements, and (d) in cells containing thermosensitive alleles of MYO2, all peroxisome movement immediately stopped at the nonpermissive temperature. In addition, time-lapse videos showing peroxisome movement in wild-type and vps1Delta cells suggest the existence of various levels of control involved in the partitioning of peroxisomes.


Figures

Figure 1.
Figure 1.
Peroxisome morphology as seen in GFP-PTS1–labeled cells. In wild-type cells, up to nine individual round-shaped peroxisomes of different size and signal intensity are discernible per cellular compartment. In this static picture no localization pattern is apparent. (B) Peroxisome morphology as seen in GFP-PTS1–labeled vps1Δ cells. The number of individual peroxisomes is significantly reduced. Most cells only carry one peroxisome. Peroxisomes appear as large tubular structures. In budded cells, the peroxisomal tubes frequently localize near the bud neck region. Five Z-axis planes spaced by 0.8 μm have been acquired and merged into one plane. (C) Dynamics of GFP-PTS1–labeled peroxisomes in wild-type cells. Before bud emergence, peroxisomes appear randomly localized (0′). After bud emergence, two to three peroxisomes localize to the growing tip and three remain in the mother cell body (10.5′). The clustered peroxisomes in the bud remain clustered at the growing tip and the peroxisomes in the mother cell maintain a relatively fixed position (36′–90′). Before cytokinesis, the peroxisomes in the bud spread and relocalize from the bud tip to the site of cytokinesis. Similar localization to the bud neck of peroxisomes can be observed in the mother cell body (141′). After cell separation, new bud emergence of the daughter cell is observed and the peroxisomes again relocalize to the growing bud tip (159′). The described characteristics can be better observed in the Video 1 (where this sequence was extracted from) and Video 2. (D) Dynamics of GFP-PTS1–labeled peroxisomes in vps1Δ cells. One large, round-shaped peroxisome localizes to the site of previous cytokinesis (0′). After new bud emergence, the peroxisome glides along the cell cortex to the site of the growing tip and transforms into an elongated structure that finally reaches into the bud neck and vigorously bends out of plane in the bud (25′–103′). After fission of the peroxisomal tube, two separated, round-shaped peroxisomes appear, one located in the mother and one in the daughter cell body (110′). After cytokinesis, the peroxisomes associated with the site of previous cell separation start to elongate and reposition to the new incipient bud sites (120′). After bud emergence and bud growth, the peroxisomes repeated the characteristic movements described for the previous cell cycle. The described characteristics can be better observed in the Video 3 (where this sequence was extracted from) and Video 4. Videos are available at http://www.jcb.org/cgi/content/full/jcb.200107028/DC1. Bars, 5 μm.
Figure 2.
Figure 2.
Morphology of peroxisomes in wild-type (A) and vps1 Δ mutant cells (B and C) visualized by immunoelectronmicroscopy. GFP-PTS1–tagged peroxisomes were identified by immunogold labeling of cryocoupes with an antibody directed against GFP. Bar, 0.5 μm.
Figure 3.
Figure 3.
Peroxisomes and Vps1 colocalization study. The figure shows still pictures of asynchronous cultures of CFP-PTS1–labeled peroxisomes depicted in red (A), YFP-labeled Vps1p depicted in green (B), and the overlay of the two signals (C). The phase-contrast depicting the shape of the cells is represented in blue. Five Z-axis planes spaced by 0.8 μm have been acquired and merged into one plane. Occasional overlaps of the two signals are also observed in the three-dimensional data (unpublished data). A video of images displayed in this figure is available at http://www.jcb.org/cgi/content/full/jcb.200107028/DC1. Bar, 5 μm.
Figure 4.
Figure 4.
Peroxisomes and microtubules colocalization study. Peroxisomes are labeled with YFP-PTS1 and microtubules with GFP-Tub1. The two cellular structures are clearly distinguishable by their morphologies. Peroxisomes appear as dot-like structures and the spindle and astral microtubules appear as bar-like, elongated structures. (A) In wild-type cells, peroxisomes are localized in the mother cell bodies and buds and show no obvious interactions with astral microtubules. Occasional overlaps in the two-dimensional representation could not be confirmed in the three- dimensional, space-filling reconstruction (unpublished data). (B) In spc72Δ cells, astral microtubules that could serve as tracks to deliver peroxisomes into the bud are completely absent. Therefore, spindles appear as bar-like structures of different length, and are mislocalized and misoriented. Nevertheless, the overall localization of peroxisomes appears similar to wild-type and early bud insertion persists. Five Z-axis planes spaced by 0.8 μm were acquired and merged into one plane. Bar, 5 μm.
Figure 5.
Figure 5.
Peroxisomes and actin cortical patches colocalization study. The figure shows still pictures of asynchronous cultures with CFP-PTS1–labeled peroxisomes depicted in red (A), CAP2- YFP–labeled actin cortical patches represented in green (B), and the overlay of the two signals (C). The phase-contrast image depicting the shape of the cell is represented in blue. Five Z-axis planes spaced by 0.8 μm have been acquired and merged into one plane. Three- dimensional reconstruction (unpublished data) shows a cortical localization of peroxisomes and actin cortical patches. (D) Dynamics of peroxisomes and actin cortical patches. Actin patches start to spread from the site of the previous cytokinesis event. Peroxisomes do not show a specific cellular localization but are very dynamic at this cell cycle stage (0′). Actin patches and peroxisomes accumulate at the site of bud emergence (25′). Before the isotropic switch occurs, actin patches and peroxisomes cluster at the growing bud tip. The mother cell body is devoid of actin patches and peroxisomes in the mother cell do not exhibit significant movements (70′). After the isotropic switch occurred, actin patches start to spread all over the bud cortex. Concomitantly, the peroxisomes lose the tip localization and also start to spread along the bud cortex (130′). Actin patches accumulate at both sides of the bud neck before cytokinesis. Some peroxisomes colocalize to these actin patches (145′). After cell separation occurred, actin patches and a subset of peroxisomes relocalize to the new site of bud emergence (160′-175′). These characteristic dynamics are better observable in the Videos 6–8, available at http://www.jcb.org/cgi/content/full/jcb.200107028/DC1, where this image series was extracted from. Bars, 5 μm.
Figure 6.
Figure 6.
Colocalization study of peroxisomes and actin cables in wild-type cells. GFP-PTS1–labeled (A) log phase cells were fixed and the actin cytoskeleton stained with phalloidin-rhodamine (B) and the two channels were overlaid to check for colocalization (C). Peroxisomes in the mother cell are almost exclusively localized on actin cables. Due to the relative brightness and out-of-focus light of actin cortical patches in small buds it is difficult to determine the localization of the peroxisomes. In large budded cells, however, peroxisomes again are detectable on actin cable structures. Actin cable–based peroxisomes are especially apparent in the cell indicated with an arrow and represented in larger magnification in D. Bars, 5 μm.
Figure 7.
Figure 7.
Colocalization study of peroxisomes and actin cables in vps1 Δ cells. GFP-PTS1–labeled (A) log phase cells were fixed and the actin cytoskeleton stained with phalloidin-rhodamine (B) and the two channels were overlaid to check for colocalization (C). Peroxisomes are almost exclusively localized on actin cables. The long peroxisomal tubules typical for vps1Δ cells orient along actin cables. This is especially apparent in the cell indicated with an arrow and represented in larger magnification in D. Bars, 5 μm.
Figure 8.
Figure 8.
Analysis of Lat-A on peroxisomal dynamics by tracking of peroxisomal movements for 15 min in wild-type cells. In cells not treated with Lat-A, highly dynamic peroxisomal movements can be observed that are described in more detail in Fig. 1 C. After Lat-A incubation, peroxisomal translocations are abolished and only oscillations persist. A few peroxisomes show nondirected translocations, probably due to detachment from the cell cortex and passive cytoplasmic movement. Tracking of peroxisomes was based on a 15 min time-lapse sequence with acquisition intervals of 15 s as shown for Video 9, available at http://www.jcb.org/cgi/content/full/jcb.200107028/DC1. In total, 10 Lat-A and 10 control cells have been analyzed with similar results.
Figure 9.
Figure 9.
Peroxisome distribution in small budded cells at 24°C as seen in GFP-PTS–labeled wild-type and myo2–66 cells. (A) Peroxisome insertion into the nascent bud at very early stages is typicial for wild-type cells. (B) In the myo2–66 mutant most cells do not localize peroxisomes into the bud at early cell cycle stages. In addition, the cells accumulate fluorescent vacuoles not observed in the wild-type cells. Bar, 5 μm.
Figure 10.
Figure 10.
Analysis of peroxisomal dynamics in GFP-PTS1–labeled MYO2, myo2-ts, and myo4 Δ cells at 24°C and 37°C by tracking of peroxisomal movements for 15 min. In all strains at 24°C, highly dynamic peroxisomal movements can be observed that are described in more detail in Fig. 1 C. At 37°C, MYO2 wild-type and myo4Δ deletion mutants exhibit peroxisomal movements similar to those observed at 24°C. The other mutants show significantly reduced peroxisomal translocations at 37°C and only minor oscillations are observable. A few peroxisomes in the myo2–66 mutants show nondirected translocations, probably due to detachment from the cell cortex and passive cytoplasmic random movement. Tracking of peroxisomes was based on 15 min time-lapse sequence with acquisition intervals of 15 s. 10 individual cells of each mutant at both temperatures have been analyzed and representative examples are shown in this figure.

References

    1. Adams, A.M., and J.R. Pringle. 1984. Relationship of actin and tubulin distribution to bud growth in wild-type and morphogenetic mutant Saccharomyces cerevisiae. J. Cell Biol. 98:934–945. - PMC - PubMed
    1. Amberg, D.C. 1998. Three-dimensional imaging of the yeast actin cytoskeleton through the budding cell cycle. Mol. Biol. Cell. 9:3259–3262. - PMC - PubMed
    1. Beach, D.L., J. Thibodeaux, P. Maddox, E. Yeh, and K. Bloom. 2000. The role of the proteins Kar9 and Myo2 in orienting the mitotic spindle of budding yeast. Curr. Biol. 10:1497–1506. - PubMed
    1. Bobola, N., R.P. Jansen, T.H. Shin, and K. Nasmith. 1996. Asymmetric accumulation of Ash1p in postanaphase nuclei depends on a myosin and restricts yeast mating-type switching to mother cells. Cell. 84:699–709. - PubMed
    1. Bretscher, A., B. Drees, E. Harsay, D. Schott, and T. Wang. 1994. What are the basic functions of microfilaments? Insights from studies in budding yeast. J. Cell Biol. 126:824–825. - PMC - PubMed

Publication types

MeSH terms

Substances