. 2001 Dec 3;194(11):1583-96.
doi: 10.1084/jem.194.11.1583.

Ligand-independent signaling functions for the B lymphocyte antigen receptor and their role in positive selection during B lymphopoiesis

Affiliations

Ligand-independent signaling functions for the B lymphocyte antigen receptor and their role in positive selection during B lymphopoiesis

G Bannish et al. J Exp Med. .

Abstract

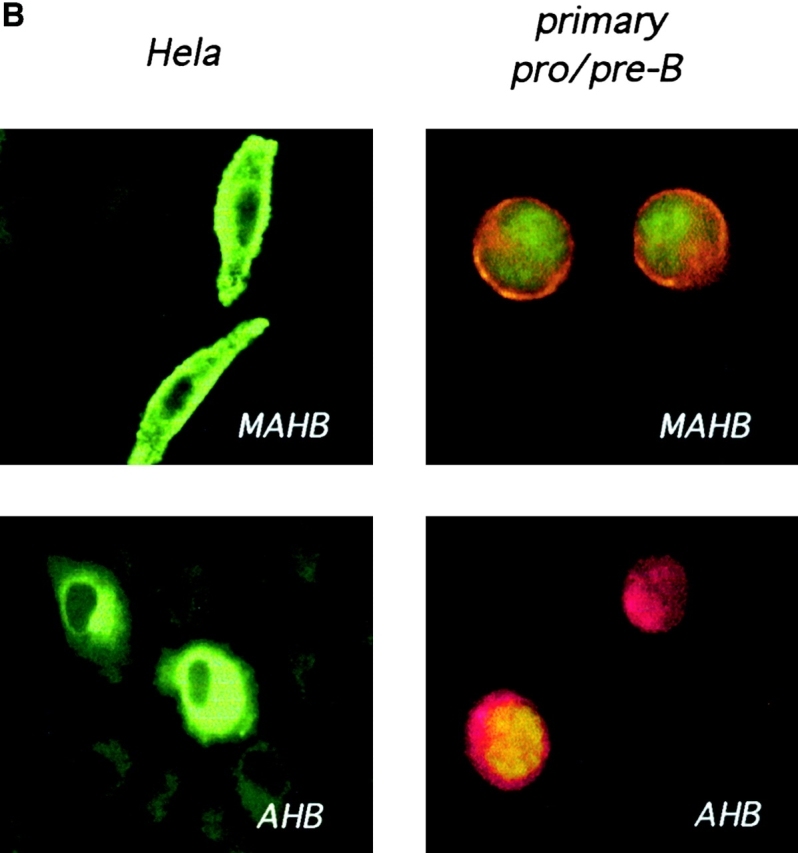
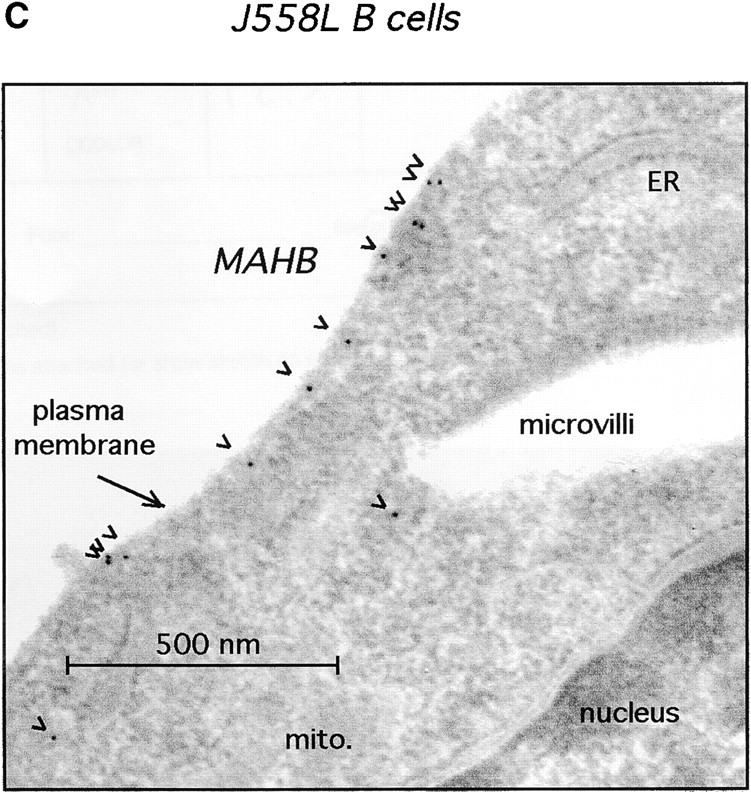
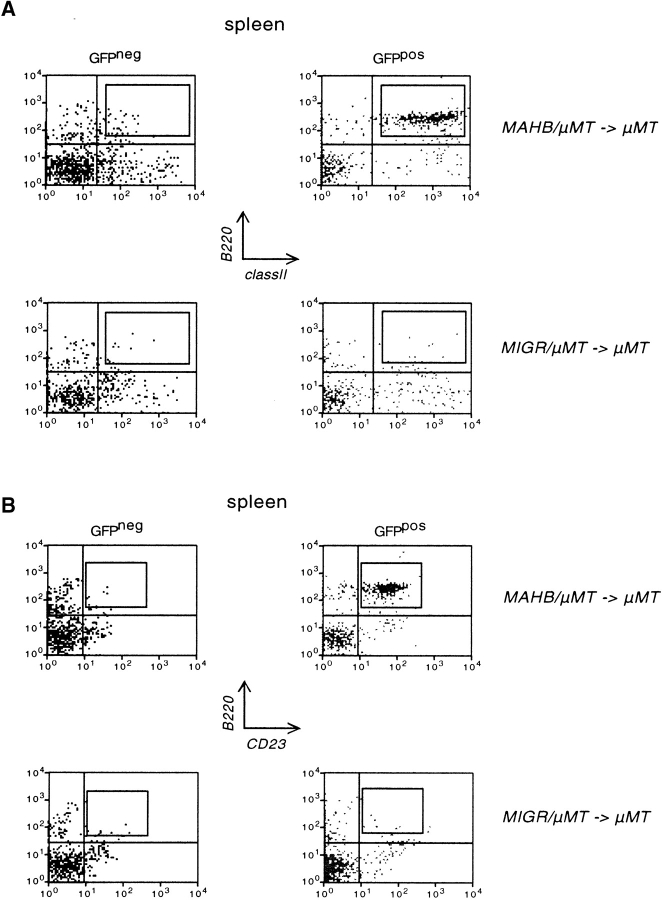
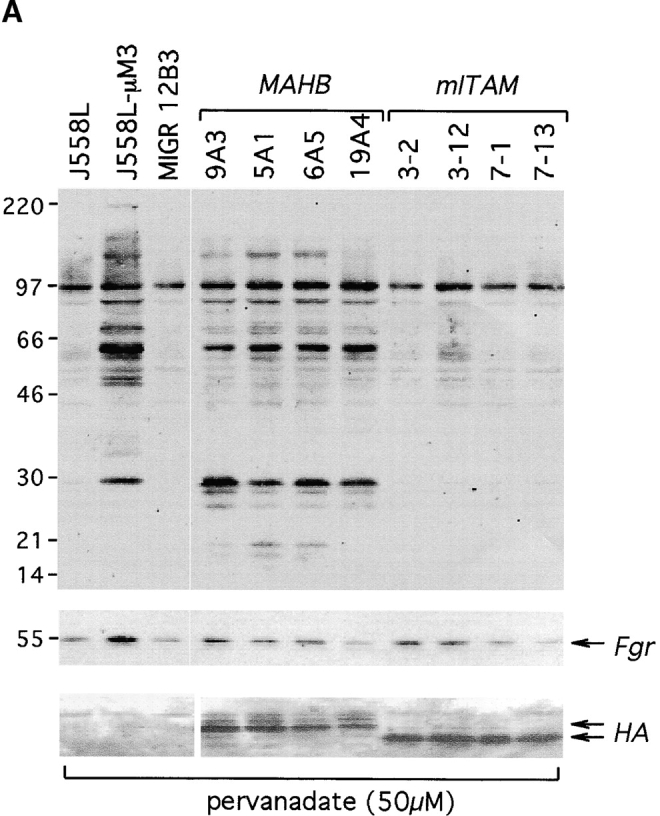
Signal transduction through the B cell antigen receptor (BCR) is determined by a balance of positive and negative regulators. This balance is shifted by aggregation that results from binding to extracellular ligand. Aggregation of the BCR is necessary for eliciting negative selection or activation by BCR-expressing B cells. However, ligand-independent signaling through intermediate and mature forms of the BCR has been postulated to regulate B cell development and peripheral homeostasis. To address the importance of ligand-independent BCR signaling functions and their regulation during B cell development, we have designed a model that allows us to isolate the basal signaling functions of immunoglobulin (Ig)alpha/Igbeta-containing BCR complexes from those that are dependent upon ligand-mediated aggregation. In vivo, we find that basal signaling is sufficient to facilitate pro-B --> pre-B cell transition and to generate immature/mature peripheral B cells. The ability to generate basal signals and to drive developmental progression were both dependent on plasma membrane association of Igalpha/Igbeta complexes and intact immunoregulatory tyrosine activation motifs (ITAM), thereby establishing a correlation between these processes. We believe that these studies are the first to directly demonstrate biologically relevant basal signaling through the BCR where the ability to interact with both conventional as well as nonconventional extracellular ligands is eliminated.


Figures

Figure 1.
Figure 1.
Recombinant protein MAHB targets Igα and Igβ cytoplasmic domains to the plasma membrane. (A) MAHB contains an NH2-terminal myristoylation/palmitoylation domain from Lck (M) cloned upstream of the cytoplasmic domains of Igα (A) and Igβ (B), and separated by a 10 aa spacer containing a HA peptide tag (H). AHB lacks the NH2-terminal myristoylation/palmitoylation site. (B) Expression and subcellular distribution of MAHB. (Left) HeLa cells were transiently transfected with the expression vector pSV2Zeo containing MAHB (top) or AHB (bottom). Cells were fixed and stained with biotinylated 12CA5 (anti-HA) followed with SA-FITC, which detects MAHB as green. (Right) Pro-B cells from RAG2−/− mice were grown in vitro with IL-7 and were infected with the retrovirus MIGR1.str, which coexpresses GFP (shown in green) and either MAHB (top) or AHB (bottom). Cells were fixed and stained with 12CA5-rhodamine, which detects MAHB by red fluorescence. (C) Electron microscopy of the MAHB myeloma clone J558L-MAHB19A4. Cells were fixed in resin, and sections were stained with a primary antibody reacting against HA and a secondary antibody containing gold particles (18 nm). MAHB is detected as black spots. (D) Sucrose gradient fractionation. The BCR-positive J558L-μM3 cell line was infected with MAHB and the resting cell line was lysed on ice and subjected to sucrose gradient fractionation as described in Materials and Methods and reference 44). Fractions were removed, equal volumes were loaded onto a polyacrylamide gel, and blots were subjected to Western blot analysis using antibodies to IgM (top) or MAHB (bottom). Fractions 1–3 contain buoyant raft fractions, and fractions 8–11 contain soluble fractions.
Figure 1.
Figure 1.
Recombinant protein MAHB targets Igα and Igβ cytoplasmic domains to the plasma membrane. (A) MAHB contains an NH2-terminal myristoylation/palmitoylation domain from Lck (M) cloned upstream of the cytoplasmic domains of Igα (A) and Igβ (B), and separated by a 10 aa spacer containing a HA peptide tag (H). AHB lacks the NH2-terminal myristoylation/palmitoylation site. (B) Expression and subcellular distribution of MAHB. (Left) HeLa cells were transiently transfected with the expression vector pSV2Zeo containing MAHB (top) or AHB (bottom). Cells were fixed and stained with biotinylated 12CA5 (anti-HA) followed with SA-FITC, which detects MAHB as green. (Right) Pro-B cells from RAG2−/− mice were grown in vitro with IL-7 and were infected with the retrovirus MIGR1.str, which coexpresses GFP (shown in green) and either MAHB (top) or AHB (bottom). Cells were fixed and stained with 12CA5-rhodamine, which detects MAHB by red fluorescence. (C) Electron microscopy of the MAHB myeloma clone J558L-MAHB19A4. Cells were fixed in resin, and sections were stained with a primary antibody reacting against HA and a secondary antibody containing gold particles (18 nm). MAHB is detected as black spots. (D) Sucrose gradient fractionation. The BCR-positive J558L-μM3 cell line was infected with MAHB and the resting cell line was lysed on ice and subjected to sucrose gradient fractionation as described in Materials and Methods and reference 44). Fractions were removed, equal volumes were loaded onto a polyacrylamide gel, and blots were subjected to Western blot analysis using antibodies to IgM (top) or MAHB (bottom). Fractions 1–3 contain buoyant raft fractions, and fractions 8–11 contain soluble fractions.
Figure 2.
Figure 2.
Comparison of ligand-induced and basal signaling through MAHB and the conventional BCR. (A) The indicated derivatives of the J558L B cell line were either untreated (left) or treated with anti-IgM (10 μg/ml) for 5 min (right), and proteins from whole cell lysates were separated by SDS-PAGE, transferred to nitrocellulose membranes, and detected by Western blotting using the antiphosphotyrosine antibody 4G10. The blot was stripped and reprobed with an antibody to Fgr for use as a protein loading control. (B) The same conditions as in panel A except that the cell lines were treated with pervanadate (50 μM) instead of anti-IgM. The (*) indicates the position of the MAHB protein. (C) Titration of pervanadate. The indicated concentrations of pervanadate were included in the media of J558L, μM3, MIGR12B3, and MAHB19A4 cell lines. Then, 166,000 cell equivalents per lane were subjected to Western analysis using the antiphosphotyrosine antibody 4G10 as in panel A. At 50 μM pervanadate, the intensities of bands in the BCRpos μM3 and the MAHB19A4 cell lines were more intense than the negative control cell lines J558L and MIGR12B3.
Figure 3.
Figure 3.
Bone marrow B cell development in MAHB-expressing μMT progenitors. Bone marrow from wild-type and μMT mice were analyzed by flow cytometry for surface expression of CD22 and CD43, along with the pan B cell markers B220 or CD19, in order to identify proB stage cells (CD22neg, CD43pos) from those B cells which have traversed the pro-B → pre-B checkpoint (CD22pos, CD43neg). Dead cells were excluded by propidium iodide exclusion in order to focus analysis on all live cells in the population. (A) B cell expression in the bone marrow. Wild-type mice (left panel) contain B cells (B220pos) at the pro-B stage (CD22neg) and at later stages (CD22neg). In contrast, B cells in μMT mice (right panel) are all at the pro-B stage. (B) B cell expression in the spleen. Wild-type mice (left panel) contain B cells (CD19pos) in the spleen, and they have progressed past the pro-B stage because they lack CD43. The μMT mice (right panel) completely lack B cells in the spleen (no CD19pos cells). (C) Bone marrow of lethally irradiated μMT mice adoptively transferred with retrovirus infected μMT bone marrow hematopoietic progenitors expressing either MAHB (top) or the empty virus vector MIGR (bottom panels). Analyses were performed 4 wk after adoptive transfer. GFPpos cells (right) are those derived from progenitors successfully infected with the indicated retrovirus; GFPneg cells (left) represent noninfected cells for comparison. The boxed region represents B cells that have progressed past the pro-B stage. Only cells from GFPpos, μMT mice contain a significant fraction of these developed B cells (boxed region of top right panel). (D) B cell development in splenic B cells from MAHB-expressing μMT mice. Spleens from adoptively transferred μMT mice were analyzed for expression of the B cell marker CD19 and the pro-B marker CD43, and results are shown as in C. Only GFPpos cells from MAHB mice contain a significant fraction of B cells (CD19pos), and they have developed past the pro-B stage (boxed region of top right panel).
Figure 4.
Figure 4.
Peripheral B cell development after adoptive transfer of MAHB-expressing μMT progenitors. Splenocytes were obtained from lethally irradiated μMT mice that had been adoptively transferred with μMT hematopoietic progenitors infected with MAHB or the empty virus vector MIGR. All panels depict flow cytometric analysis of surface B220 on splenocytes gated with forward and side scatter to eliminate dead cells. (A) MHC class II expression on splenocytes from MAHB (top) or MIGR (bottom) expressing μMT mice. Retrovirus-expressing cells were selected by gating on GFP (right panels), whereas uninfected GFPneg cells represented an internal negative control (left panels). Only GFPpos cells from MAHB μMT mice contain B cells that express MHC class II (boxed region of top right panel). (B) Same as in panel A except analyzed for CD23 expression. The MHC class II positive B cells from panel A coexpress the CD23 marker shown in B (unpublished data).
Figure 7.
Figure 7.
ITAM dependence for aggregation-independent signaling and basal signaling. (A) Pervanadate stimulation and comparison of wild-type MAHB (clones 9A3, 5A1, 6A5, 19A4) and MAHB with mutated ITAM motifs (mITAM clones 3–2, 3–12, 7–1, 7–13) expressing J558L B cells. The indicated cell lines were stimulated with pervanadate, and Western blots were probed with antiphosphotyrosine (top), anti-Fgr (middle), and anti-HA (bottom; same as Fig. 6). (B) Splenic cells from μMT mice containing MAHB or mITAM were analyzed for expression of B220 and CD22 (top), or for B220 and CD43 (bottom; same as for Fig. 3, C and D).
Figure 7.
Figure 7.
ITAM dependence for aggregation-independent signaling and basal signaling. (A) Pervanadate stimulation and comparison of wild-type MAHB (clones 9A3, 5A1, 6A5, 19A4) and MAHB with mutated ITAM motifs (mITAM clones 3–2, 3–12, 7–1, 7–13) expressing J558L B cells. The indicated cell lines were stimulated with pervanadate, and Western blots were probed with antiphosphotyrosine (top), anti-Fgr (middle), and anti-HA (bottom; same as Fig. 6). (B) Splenic cells from μMT mice containing MAHB or mITAM were analyzed for expression of B220 and CD22 (top), or for B220 and CD43 (bottom; same as for Fig. 3, C and D).
Figure 5.
Figure 5.
Expression level dependence of MAHB driven B cell development from μMT progenitors. Erythrocyte-depleted cells from the bone marrow of an MAHB reconstituted μMT mouse were analyzed for expression of B220, CD22, and CD43. (A) Live cells were selected using a forward and side scatter gate, and analyzed for levels of GFP expression. The reconstituted MAHB is lightly shaded, and bone marrow from a normal mouse was used as a negative control (dark shaded). (B) B cells from the bone marrow were selected by gating on B220 and analyzed for GFP expression. A series of gates were drawn to distinguish GFP negative (gates 2 and 3), low (gates 4 and 5), and high (gates 6–10). (C) Cells were gated for B220 and the levels of GFP expression in B, and CD43 versus CD22 plots were obtained. For each gate, the percentage of CD22pos CD43neg cells is shown, which represents B cell progression past the pro-B stage.
Figure 6.
Figure 6.
Plasma membrane localization is required for basal signaling in the presence of protein tyrosine phosphatase inhibitor pervanadate. (A) J558L-μM3, J558L expressing the empty MIGR retrovirus (MIGR12B3), MAHB (MAHB19A4), or MPP (clones 1, 9, 10) were cultured for 2 min in media containing 50 μM pervanadate followed by analysis of tyrosine phosphoproteins as in Fig. 2 B. The far leftmost lane depicts J558L cells in the absence of pervanadate treatment for comparison. (B) The blot was stripped and reprobed with antibodies to either the HA epitope tag (HA) for verification of MAHB expression, or to the B cell expressing protein Fgr for use as a loading control (Fgr).
Figure 6.
Figure 6.
Plasma membrane localization is required for basal signaling in the presence of protein tyrosine phosphatase inhibitor pervanadate. (A) J558L-μM3, J558L expressing the empty MIGR retrovirus (MIGR12B3), MAHB (MAHB19A4), or MPP (clones 1, 9, 10) were cultured for 2 min in media containing 50 μM pervanadate followed by analysis of tyrosine phosphoproteins as in Fig. 2 B. The far leftmost lane depicts J558L cells in the absence of pervanadate treatment for comparison. (B) The blot was stripped and reprobed with antibodies to either the HA epitope tag (HA) for verification of MAHB expression, or to the B cell expressing protein Fgr for use as a loading control (Fgr).

References

    1. Bromley, S.K., W.R. Burack, K.G. Johnson, K. Somersalo, T.N. Sims, C. Sumen, M.M. Davis, A.S. Shaw, P.M. Allen, and M.L. Dustin. 2001. The immunological synapse. Annu. Rev. Immunol. 19:375–396. - PubMed
    1. Monks, C.R., B.A. Freiberg, H. Kupfer, N. Sciaky, and A. Kupfer. 1998. Three-dimensional segregation of supramolecular activation clusters in T cells. Nature. 395:82–86. - PubMed
    1. Delon, J., and R.N. Germain. 2000. Information transfer at the immunological synapse. Curr. Biol. 10:R923–R933. - PubMed
    1. Batista, F.D., D. Iber, and M.S. Neuberger. 2001. B cells acquire antigen from target cells after synapse formation. Nature. 411:489–494. - PubMed
    1. Korade-Mirnics, Z., and S.J. Corey. 2000. Src kinase-mediated signaling in leukocytes. J. Leukoc. Biol. 68:603–613. - PubMed

Publication types

MeSH terms