. 2001 Dec 3;194(11):1639-47.
doi: 10.1084/jem.194.11.1639.

Relation of gene expression phenotype to immunoglobulin mutation genotype in B cell chronic lymphocytic leukemia

Affiliations

Relation of gene expression phenotype to immunoglobulin mutation genotype in B cell chronic lymphocytic leukemia

A Rosenwald et al. J Exp Med. .

Abstract

The most common human leukemia is B cell chronic lymphocytic leukemia (CLL), a malignancy of mature B cells with a characteristic clinical presentation but a variable clinical course. The rearranged immunoglobulin (Ig) genes of CLL cells may be either germ-line in sequence or somatically mutated. Lack of Ig mutations defined a distinctly worse prognostic group of CLL patients raising the possibility that CLL comprises two distinct diseases. Using genomic-scale gene expression profiling, we show that CLL is characterized by a common gene expression "signature," irrespective of Ig mutational status, suggesting that CLL cases share a common mechanism of transformation and/or cell of origin. Nonetheless, the expression of hundreds of other genes correlated with the Ig mutational status, including many genes that are modulated in expression during mitogenic B cell receptor signaling. These genes were used to build a CLL subtype predictor that may help in the clinical classification of patients with this disease.


Figures

Figure 1.
Figure 1.
Discovery of a common gene expression phenotype in CLL. (A) 328 Lymphochip array elements representing ∼247 genes that were more highly expressed as mRNA in the majority of CLL samples relative to DLBCL samples. The expression data are presented as a matrix in which the rows represent individual genes, and the columns represent individual mRNA samples. The relative level of gene expression is depicted according to the color scale shown at the bottom. Gray squares indicate missing or excluded data. (B) Relative expression levels of selected genes from A in mRNA samples presented in the following order, from left to right: cell lines (JVM-HH, OCI-Ly10, OCI-Ly3, U937); T cells (adult, CD4+, unstimulated; neonatal, CD4+, unstimulated; fetal, CD4+, unstimulated; adult, CD4+, + PMA [P] and ionomycin [I]; neonatal cord blood T cells, + P and I; fetal, CD4+, + P and I), resting B-cells (cord blood CD19+ B cells; adult blood CD19+ B cells), activated B cells (adult blood B cells, anti-IgM + CD40L 6 h; adult blood B cells, anti-IgM 24 h; adult blood B cells, anti-IgM + CD40L 24 h; adult blood B cells, anti-IgM + IL-4 24 h), adult blood memory B-cells (CD27+), tonsil germinal center B cells, follicular lymphomas (n = 7), DLBCLs (n = 40), and CLL (n = 37). The CLL samples were grouped according to Ig mutational status as indicated. In the gene names, an asterisk denotes a sequence verified gene, IM indicates an IMAGE consortium (reference 29) clone identification number, and LC indicates an unsequenced Lymphochip clone identification number. (C) Relative expression levels of selected genes characteristic of the germinal center B cell differentiation stage.
Figure 4.
Figure 4.
Relative gene expression levels of CLL subtype distinction genes. (A) Hierarchical clustering of gene expression data for 205 array elements representing ∼175 genes that were differentially expressed between mutated and unmutated CLL samples (P < 0.001). (B) Hierarchical clustering of genes that most strongly discriminated between the CLL subtypes. Also shown for each gene is the ratio of mean expression of the gene in Ig-unmutated CLL samples (excluding CLL-60) versus mean expression in Ig-mutated (high) CLL samples, together with the P values (Student's t test) that quantitate the significance of the difference in mean expression between the two CLL subtypes. (C) RT-PCR analysis of ZAP-70 expression. Shown are data from two Ig-unmutated and two Ig-mutated CLL cases, a T cell line (Jurkat), various B cell lines found by microarray analysis to express ZAP-70 (LILA, LK6, OCI-Ly2), and a B cell line not expressing ZAP-70 (Raji; C, and data not shown). The control lane represents a reaction in which the reverse transcriptase was omitted.
Figure 5.
Figure 5.
(A and B) Response of CLL subtype distinction genes during B cell activation. Gene expression data from the following B cell samples is depicted: 1, gene expression average from three resting B cell samples; 2, blood B cells, anti-IgM 6 h; 3, blood B cells, anti-IgM + CD40L 6 h; 4, blood B cells, anti-IgM + IL-4; 5, blood B cells, anti-IgM + CD40L + IL-4; 6, blood B cells, anti-IgM 24 h; 7, blood B cells, anti-IgM + CD40L 24 h; 8, blood B cells, anti-IgM + IL-4 24 h; 9, blood B cells, anti-IgM + CD40L + IL-4 24 h; 10–11, blood B cells, anti-IgM + CD40L + IL-4 48 h. (C) Percentage of CLL subtype distinction genes (red bar) and all ‘Lymphochip’ genes (blue bar) that are induced during B cell activation.
Figure 2.
Figure 2.
Analysis of somatic mutations in the Ig VH genes in 28 CLL patients and correlation with their clinical courses. (A) VH gene usage and distribution of replacement (▴) and silent (*) mutations in the complementarity determining regions (CDRs) and framework regions (FWs). #, VH sequence most homologous to multiple cDNA sequences. (B) Kaplan-Meier curve comparing the time from diagnosis to treatment between CLL patients with mutated and unmutated VH genes. Median time to treatment in Ig-mutated CLL: 95 mo; median time to treatment in Ig-unmutated CLL: 28 mo. The difference is significant at the P = 0.001 level (log-rank test).
Figure 3.
Figure 3.
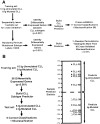
Statistical methodology for the creation and validation of an Ig-mutational status predictor in CLL. (A) Performance of the predictor using a cross-validation strategy. (B) Performance of the Ig-mutational subtype predictor in a test set of six unmutated (*) and four mutated CLL (Δ) samples.

References

    1. Fais, F., F. Ghiotto, S. Hashimoto, B. Sellars, A. Valetto, S.L. Allen, P. Schulman, V.P. Vinciguerra, K. Rai, L.Z. Rassenti, et al. 1998. Chronic lymphocytic leukemia B cells express restricted sets of mutated and unmutated antigen receptors. J. Clin. Invest. 102:1515–1525. - PMC - PubMed
    1. Hamblin, T.J., Z. Davis, A. Gardiner, D.G. Oscier, and F.K. Stevenson. 1999. Unmutated Ig V(H) genes are associated with a more aggressive form of chronic lymphocytic leukemia. Blood. 94:1848–1854. - PubMed
    1. Damle, R.N., T. Wasil, F. Fais, F. Ghiotto, A. Valetto, S.L. Allen, A. Buchbinder, D. Budman, K. Dittmar, J. Kolitz, et al. 1999. Ig V gene mutation status and CD38 expression as novel prognostic indicators in chronic lymphocytic leukemia. Blood. 94:1840–1847. - PubMed
    1. Jacob, J., G. Kelsoe, K. Rajewsky, and U. Weiss. 1991. Intraclonal generation of antibody mutants in germinal centers. Nature. 354:389–392. - PubMed
    1. Klein, U., T. Goossens, M. Fischer, H. Kanzler, A. Braeuninger, K. Rajewsky, and R. Kuppers. 1998. Somatic hypermutation in normal and transformed human B cells. Immunol. Rev. 162:261–281. - PubMed

Publication types

Substances