. 2001 Dec 3;194(11):1675-81.
doi: 10.1084/jem.194.11.1675.

Cytotoxic T lymphocyte antigen 4 and CD28 modulate cell surface raft expression in their regulation of T cell function

Affiliations

Cytotoxic T lymphocyte antigen 4 and CD28 modulate cell surface raft expression in their regulation of T cell function

M Martin et al. J Exp Med. .

Abstract

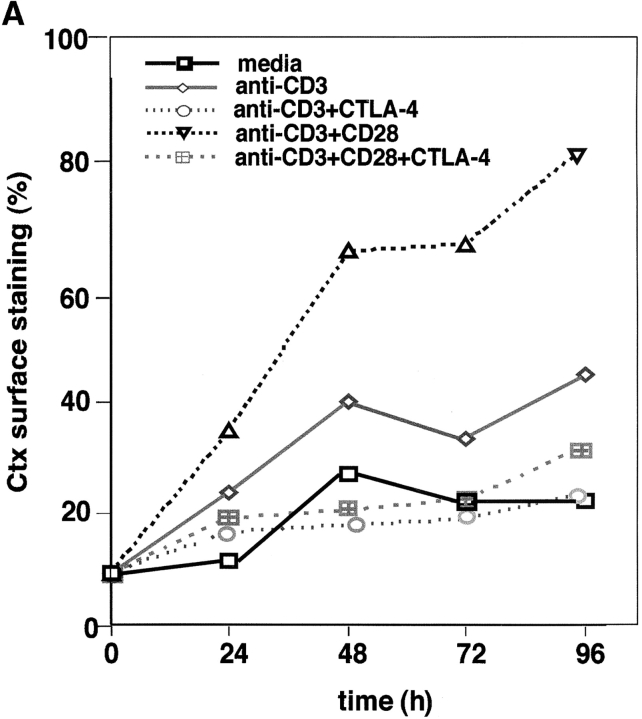
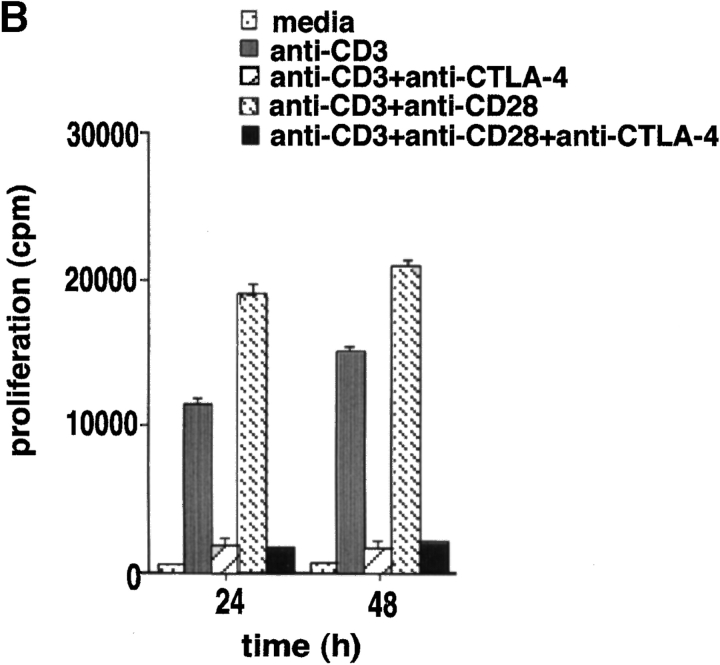
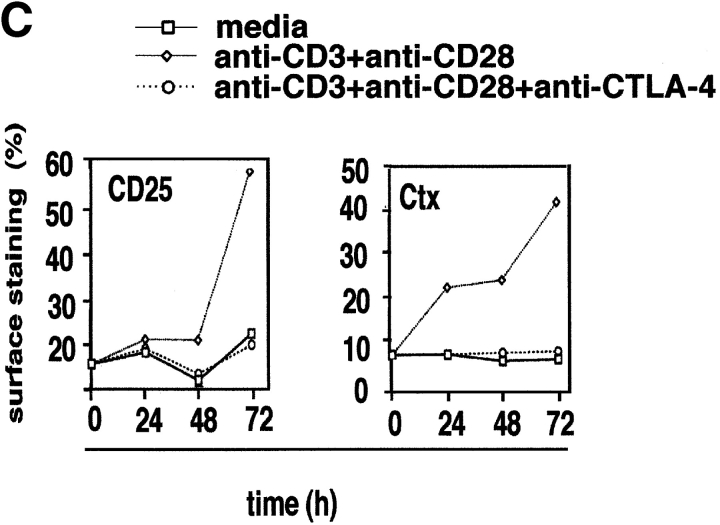
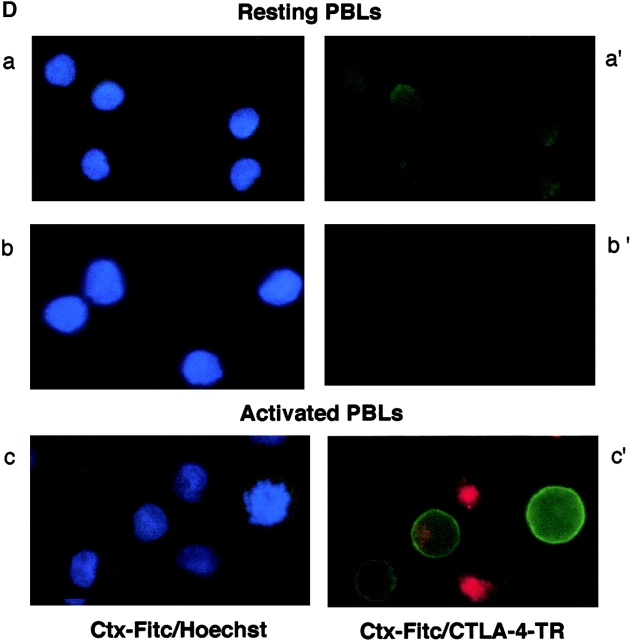
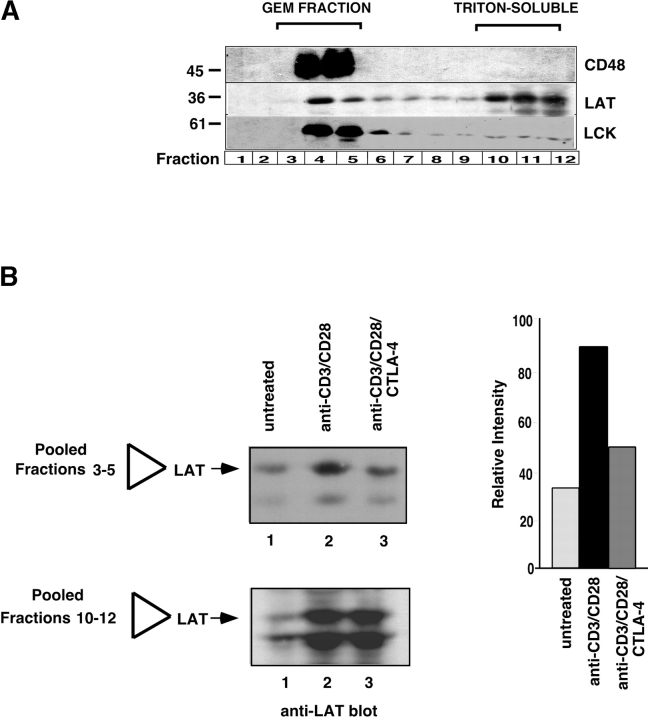
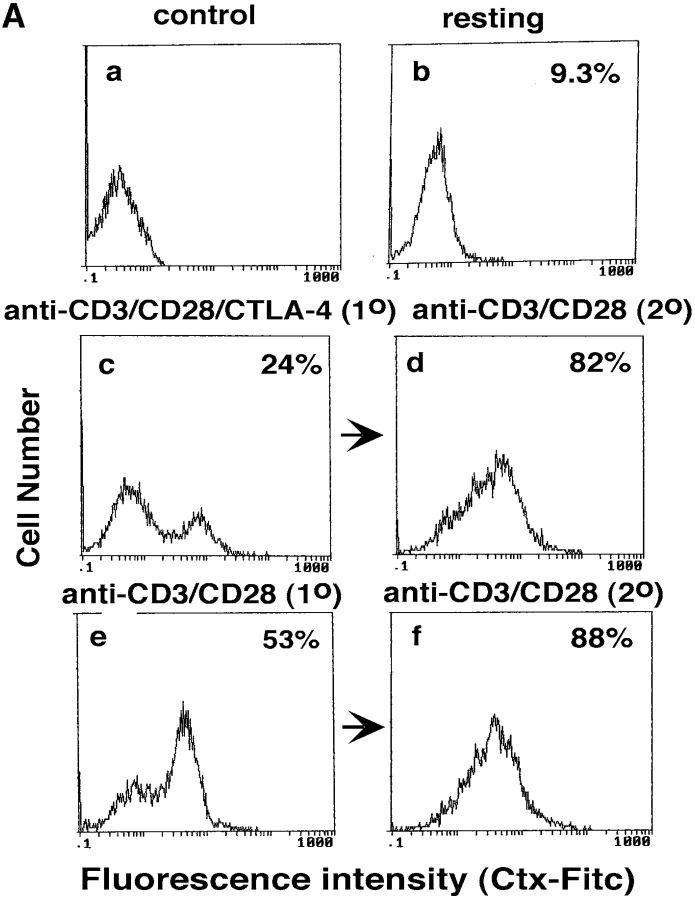
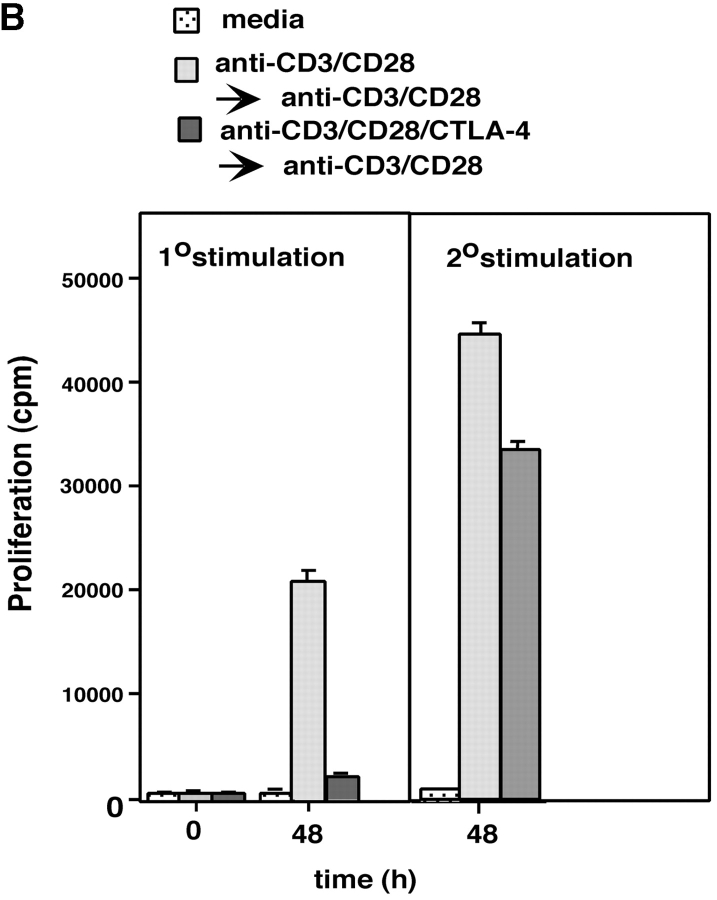
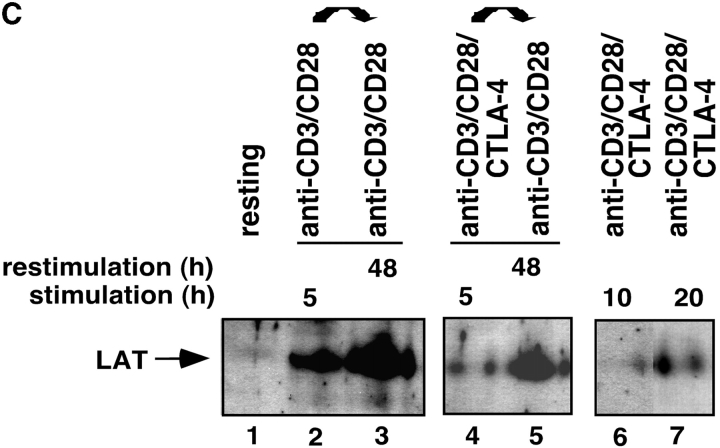
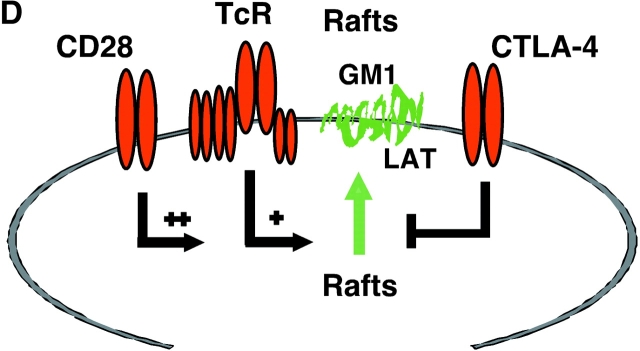
Coreceptors CD28 and cytotoxic T lymphocyte antigen (CTLA)-4 have opposing effects on TcR/CD3 activation of T cells. While CD28 enhances and CTLA-4 inhibits activation, the underlying molecular basis of these effects has yet to be established. In this context, ganglioside and cholesterol enriched membrane microdomains (rafts, GEMs) serve as centers of signaling in T cells. Although CD28 can promote TcR/raft colocalization, evidence is lacking on whether the surface expression of membrane rafts can be targeted by CTLA-4 in its modulation of T cell responses. In this study, we demonstrate that both CD28 and CTLA-4 profoundly alter the surface expression of membrane rafts during T cell activation. While CD28 increased expression and the number of peripheral T cells induced to express surface rafts in response to TcR ligation, CTLA-4 potently inhibited both TcR and TcR x CD28 induced raft expression on the surface of T cells. Consistent with this, CD28 increased the presence of the linker of activated T cells (LAT) in purified membrane rafts, while CTLA-4 coligation effectively blocked this increase. Further, the reversal of the CTLA-4 block with CD3/CD28 ligation was accompanied by an increase in surface raft expression and associated LAT. Our observations demonstrate for the first time that CTLA-4 targets the release of rafts to the surface of T cells, and provides a mechanism for the opposing effects of CD28 and CTLA-4 on costimulation.


Figures

Figure 1.
Figure 1.
CD28 and CTLA-4 regulate the formation of membrane rafts on the surface of T cells. (A) Resting human peripheral T cells were (2 × 10⁵) were stimulated with the following mAbs coated to Dynabeads: anti-CD3 (rectangle), anti-CD3/CTLA-4 (circle), anti-CD3/CD28 (triangle), and anti-CD3/CD28/CTLA-4 (crossed square) for 0, 24, 48, 72, and 96 h. Nonstimulated cells (square) served as a negative control. After the indicated time, cells were washed, stained with Ctx-FITC, fixed, and analyzed for GM1-positive cells (percentage). (B) Resting human cells stimulated with anti-CD3 (gray bars), anti-CD3/CTLA-4 (striped bars), anti-CD3/CD28 (hatched bars), and anti-CD3/CD28/CTLA-4 (black bars) coated beads for 24 and 48 h were pulsed with [3H]thymidine for the last 18 h at the indicated periods of time. Cells cultured in media alone served as a negative control (dotted bars). (C) Resting human peripheral T cells were stimulated with anti-CD3/CD28 (triangle) and anti-CD3/CD28/CTLA-4 (circle) coated beads for 0, 24, 48, and 72 h. Nonstimulated cells served as a negative control (square). After the indicated time, cells were washed and stained with anti CD25-FITC and Ctx-FITC, fixed, and analyzed for CD25 and Ctx surface expression by FACS®. (D) Immunofluorescence visualization of GM1 and CTLA-4 expression in resting and activated peripheral T cells. Resting lymphocytes were first permeabilized and then stained with Hoechst and FITC-labeled Ctx (a) or FITC-labeled Ctx and biotinylated CTLA-4/anti–IgG2a- Avidin-Texas Red (a′). Panel b: nonpermeabilized resting lymphocytes were stained with Hoechst and FITC-labeled Ctx (b), or stained only with FITC-labeled Ctx followed by fixation, permeabilization, and staining with biotinylated CTLA-4/anti–IgG2a-Avidin-Texas Red (b′). Panel c: to activate peripheral blood lymphocytes, cells were incubated with plate-bound anti-CD3 plus anti-CD28 mAbs (5 μg/ml of each). After 48 h, cells were first stained with Hoechst and FITC-labeled Ctx (c), and then additionally fixed, permeabilized, and stained with biotinylated CTLA-4/anti-IgG2a-Avidin-Texas Red (c′).
Figure 1.
Figure 1.
CD28 and CTLA-4 regulate the formation of membrane rafts on the surface of T cells. (A) Resting human peripheral T cells were (2 × 10⁵) were stimulated with the following mAbs coated to Dynabeads: anti-CD3 (rectangle), anti-CD3/CTLA-4 (circle), anti-CD3/CD28 (triangle), and anti-CD3/CD28/CTLA-4 (crossed square) for 0, 24, 48, 72, and 96 h. Nonstimulated cells (square) served as a negative control. After the indicated time, cells were washed, stained with Ctx-FITC, fixed, and analyzed for GM1-positive cells (percentage). (B) Resting human cells stimulated with anti-CD3 (gray bars), anti-CD3/CTLA-4 (striped bars), anti-CD3/CD28 (hatched bars), and anti-CD3/CD28/CTLA-4 (black bars) coated beads for 24 and 48 h were pulsed with [3H]thymidine for the last 18 h at the indicated periods of time. Cells cultured in media alone served as a negative control (dotted bars). (C) Resting human peripheral T cells were stimulated with anti-CD3/CD28 (triangle) and anti-CD3/CD28/CTLA-4 (circle) coated beads for 0, 24, 48, and 72 h. Nonstimulated cells served as a negative control (square). After the indicated time, cells were washed and stained with anti CD25-FITC and Ctx-FITC, fixed, and analyzed for CD25 and Ctx surface expression by FACS®. (D) Immunofluorescence visualization of GM1 and CTLA-4 expression in resting and activated peripheral T cells. Resting lymphocytes were first permeabilized and then stained with Hoechst and FITC-labeled Ctx (a) or FITC-labeled Ctx and biotinylated CTLA-4/anti–IgG2a- Avidin-Texas Red (a′). Panel b: nonpermeabilized resting lymphocytes were stained with Hoechst and FITC-labeled Ctx (b), or stained only with FITC-labeled Ctx followed by fixation, permeabilization, and staining with biotinylated CTLA-4/anti–IgG2a-Avidin-Texas Red (b′). Panel c: to activate peripheral blood lymphocytes, cells were incubated with plate-bound anti-CD3 plus anti-CD28 mAbs (5 μg/ml of each). After 48 h, cells were first stained with Hoechst and FITC-labeled Ctx (c), and then additionally fixed, permeabilized, and stained with biotinylated CTLA-4/anti-IgG2a-Avidin-Texas Red (c′).
Figure 2.
Figure 2.
Raft associated LAT is reduced by CTLA-4 coligation. (A) Separation of GEMs and Triton X-100 soluble material by discontinuous sucrose gradient. The GEM fraction were purified as a Triton X-100 insoluble fraction at the 5/35% interface as described (reference 31). Fractions 3–5 correspond to the GEM fraction, while fractions 10–12 correspond to the Triton-soluble fraction. Equal amounts of cell lysates of fractions 1–12 were loaded and immunoblotting was performed with anti-CD48 (top panel), anti-LAT (middle panel), and anti-lck (bottom panel) antibodies. (B) CTLA-4 coligation with anti-CD28/CD3 reduces the presence of LAT in the GEM fraction. Left panel: equal amounts of cell lysates from GEM fractions (–5) and triton-soluble fractions (–12) obtained from untreated T cells (lane 1), or stimulated for 19 h with anti-CD3/CD28 (lane 2) and anti-CD3/CD8/CTLA-4 (lane 3) were separated on a 12% SDS-PAGE and immunoblotted with anti-LAT antibody. Right panel: histogram depiction of the levels of LAT protein as detected by densitometric reading.
Figure 3.
Figure 3.
CD28 reverses the CTLA-4 block in the formation of rafts as assessed by GM1 expression and levels of raft-associated LAT. (A) Purified naive T cells were activated with anti-CD3/CD28/CTLA-4 or anti-CD3/CD28/TNP coated beads for 48 h (primary stimulation). After this period of time, anti-CD3/CD28/CTLA-4 or anti-CD3/CD28/TNP activated cells were washed and stained with Ctx-FITC for surface GM1 expression, respectively (c and e). Cells stained with goat anti–mouse FITC served as a negative control (a). Restimulation (secondary stimulation) was then performed by incubating the cells with anti-CD3/CD28 coated beads for further 48 h, respectively (d and f). After this time, cells were washed, stained with Ctx-FITC and analyzed for GM1 surface expression by FACS®. GM1 surface expression in resting PBLs is shown in panel b. (B) Proliferation was measured by pulsing the cells, stimulated as described in panel A, with [3H]thymidine for the last 18 h. Control (dotted bars), anti-CD3/CD28 (1°) followed by anti-CD3/CD28 (2°) (light gray bars), and anti-CD3/CD28/CTLA-4 (1°) followed by anti-CD3/CD28 (2°) (dark gray bars). (C) Equal amounts of cell lysates from GEM fractions (–5) obtained from untreated and stimulated cells were separated on a 12% PAGE-Gel and immunoblotted with anti-LAT antibody. Lane 1: untreated cells; lanes 2 and 3: cells stimulated with anti-CD3/CD28 mAbs for 5 h (lane 2) and restimulated with anti-CD3/CD28 mAbs for 48 h (lane 3); lanes 4 and 5: cells stimulated with anti-CD3/CD28/CTLA-4 mAb for 5 h (lane 4) and restimulated with anti-CD3/CD28 mAbs for 48 h (lane 5); lanes 6 and 7: cells stimulated with anti-CD3/CD28/CTLA-4 mAbs for 10 h (lane 6) and 20 h (lane 7). (D) Model of CTLA-4 blockage of raft expression on the surface of T cells. TcR can induce the appearance of rafts on the surface of T cells. CD28 enhances raft expression induced by TcR ligation, and especially can increase the recruitment of cells to express membrane rafts that would not normally do so with TcR ligation alone. By contrast, CTLA-4 reduced the expression on TcR-induced GM1-positive cells, and dramatically on the numbers of cells to express rafts as a result of CD28 costimulation. Both the level of GM1 expression and the presence of the adaptor protein LAT in rafts was altered in a manner consistent with the opposing effects on the coreceptors on T cell function.
Figure 3.
Figure 3.
CD28 reverses the CTLA-4 block in the formation of rafts as assessed by GM1 expression and levels of raft-associated LAT. (A) Purified naive T cells were activated with anti-CD3/CD28/CTLA-4 or anti-CD3/CD28/TNP coated beads for 48 h (primary stimulation). After this period of time, anti-CD3/CD28/CTLA-4 or anti-CD3/CD28/TNP activated cells were washed and stained with Ctx-FITC for surface GM1 expression, respectively (c and e). Cells stained with goat anti–mouse FITC served as a negative control (a). Restimulation (secondary stimulation) was then performed by incubating the cells with anti-CD3/CD28 coated beads for further 48 h, respectively (d and f). After this time, cells were washed, stained with Ctx-FITC and analyzed for GM1 surface expression by FACS®. GM1 surface expression in resting PBLs is shown in panel b. (B) Proliferation was measured by pulsing the cells, stimulated as described in panel A, with [3H]thymidine for the last 18 h. Control (dotted bars), anti-CD3/CD28 (1°) followed by anti-CD3/CD28 (2°) (light gray bars), and anti-CD3/CD28/CTLA-4 (1°) followed by anti-CD3/CD28 (2°) (dark gray bars). (C) Equal amounts of cell lysates from GEM fractions (–5) obtained from untreated and stimulated cells were separated on a 12% PAGE-Gel and immunoblotted with anti-LAT antibody. Lane 1: untreated cells; lanes 2 and 3: cells stimulated with anti-CD3/CD28 mAbs for 5 h (lane 2) and restimulated with anti-CD3/CD28 mAbs for 48 h (lane 3); lanes 4 and 5: cells stimulated with anti-CD3/CD28/CTLA-4 mAb for 5 h (lane 4) and restimulated with anti-CD3/CD28 mAbs for 48 h (lane 5); lanes 6 and 7: cells stimulated with anti-CD3/CD28/CTLA-4 mAbs for 10 h (lane 6) and 20 h (lane 7). (D) Model of CTLA-4 blockage of raft expression on the surface of T cells. TcR can induce the appearance of rafts on the surface of T cells. CD28 enhances raft expression induced by TcR ligation, and especially can increase the recruitment of cells to express membrane rafts that would not normally do so with TcR ligation alone. By contrast, CTLA-4 reduced the expression on TcR-induced GM1-positive cells, and dramatically on the numbers of cells to express rafts as a result of CD28 costimulation. Both the level of GM1 expression and the presence of the adaptor protein LAT in rafts was altered in a manner consistent with the opposing effects on the coreceptors on T cell function.

References

    1. June, C.H., J.A. Bluestone, L.M. Nadler, and C.B. Thompson. 1994. The B7 and CD28 receptor families. Immunol. Today. 15:321–331. - PubMed
    1. Chambers, C.A., and J.P. Allison. 1999. Co-stimulatory regulation of T cell function. Curr. Opin. Cell. Biol. 11:203–210. - PubMed
    1. Walunas, T.L., D.J. Lenschow, C.Y. Bakker, P.S. Linsley, G.J. Freeman, J.M. Green, C.B. Thompson, and J.A. Bluestone. 1994. CTLA-4 can function as a negative regulator of T cell activation. Immunity. 1:405–413. - PubMed
    1. Krummel, M.F., and J.P. Allison. 1995. CD28 and CTLA-4 have opposing effects on the response of T cells to stimulation. J. Exp. Med. 182:459–465. - PMC - PubMed
    1. Rudd, C.E. 1996. Upstream-downstream: CD28 cosignaling pathways and T cell function. Immunity. 4:527–534. - PubMed

Publication types

MeSH terms