

Epstein-Barr virus nuclear antigen 1 activates transcription from episomal but not integrated DNA and does not alter lymphocyte growth
- PMID: 11734622
- PMCID: PMC65012
- DOI: 10.1073/pnas.211556598
Epstein-Barr virus nuclear antigen 1 activates transcription from episomal but not integrated DNA and does not alter lymphocyte growth
Abstract
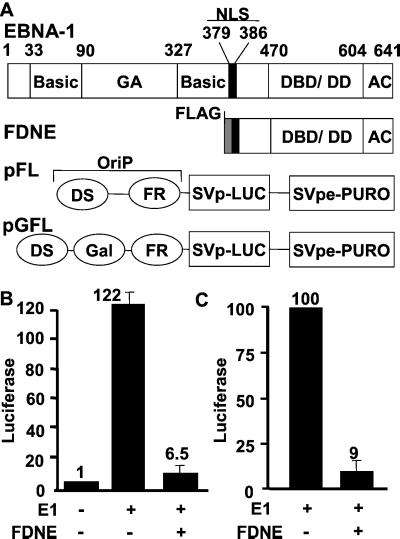
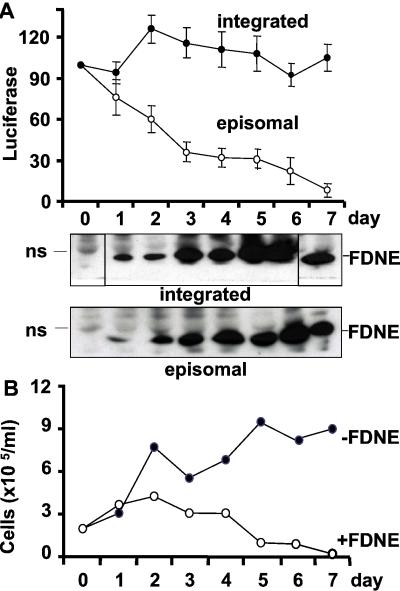
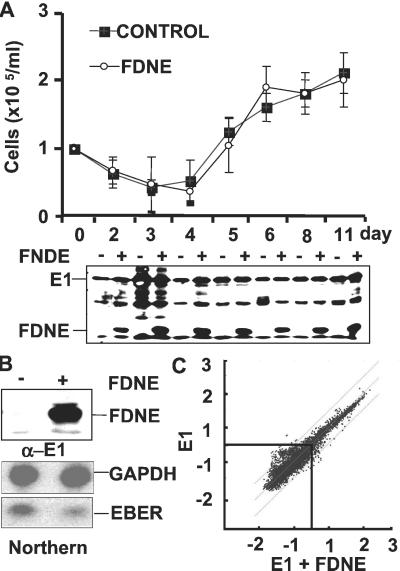
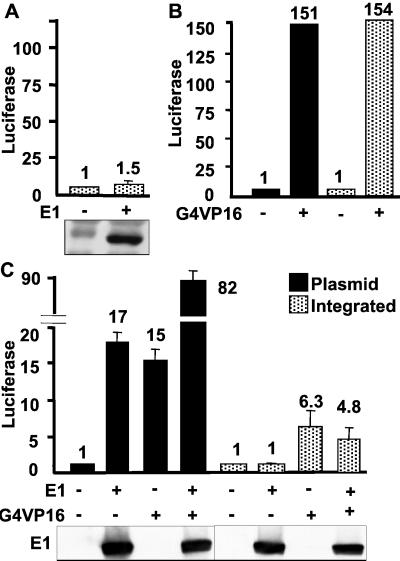
By binding to a cis-acting element (oriP) in the Epstein-Barr virus (EBV) genome, EBV nuclear antigen 1 (EBNA1) enables persistence and enhances transcription from EBV episomes. To investigate whether EBNA1 also directly affects cell gene transcription, we conditionally expressed a Flag-tagged dominant negative EBNA1 (FDNE) in an EBV immortalized lymphoblastoid cell line, in which the EBV genome is integrated into cell DNA. FDNE induction inhibited expression from an EBNA1-dependent oriP reporter plasmid by more than 90% in these cells but did not affect expression from integrated EBV or oriP reporter DNA. FDNE induction also did not alter expression of more than 1,800 cellular mRNAs. Lymphoblastoid cell line growth under a variety of conditions was unaffected by FDNE induction. Although Gal4-VP16 and EBNA1 strongly activated and coactivated a Gal4-VP16- and oriP-dependent promoter that was on an episome, only Gal4-VP16 activated the promoter when it was integrated into chromosomal DNA. These data indicate that EBNA1 is specifically deficient in activation of an integrated oriP enhancer and does not affect cell growth or gene expression through an interaction with cognate chromosomal DNA.
Figures

Similar articles
-
Metaphase chromosome tethering is necessary for the DNA synthesis and maintenance of oriP plasmids but is insufficient for transcription activation by Epstein-Barr nuclear antigen 1.J Virol. 2003 Nov;77(21):11767-80. doi: 10.1128/jvi.77.21.11767-11780.2003. J Virol. 2003. PMID: 14557661 Free PMC article.
-
Nucleolin is important for Epstein-Barr virus nuclear antigen 1-mediated episome binding, maintenance, and transcription.Proc Natl Acad Sci U S A. 2014 Jan 7;111(1):243-8. doi: 10.1073/pnas.1321800111. Epub 2013 Dec 16. Proc Natl Acad Sci U S A. 2014. PMID: 24344309 Free PMC article.
-
HCF1 and OCT2 Cooperate with EBNA1 To Enhance OriP-Dependent Transcription and Episome Maintenance of Latent Epstein-Barr Virus.J Virol. 2016 May 12;90(11):5353-5367. doi: 10.1128/JVI.00239-16. Print 2016 Jun 1. J Virol. 2016. PMID: 27009953 Free PMC article.
-
Replication licensing of the EBV oriP minichromosome.Curr Top Microbiol Immunol. 2001;258:13-33. doi: 10.1007/978-3-642-56515-1_2. Curr Top Microbiol Immunol. 2001. PMID: 11443858 Review.
-
[Epstein-Barr Virus Genome Replication as a Molecular Target for Cancer Therapy].Yakugaku Zasshi. 2019;139(1):63-67. doi: 10.1248/yakushi.18-00164-1. Yakugaku Zasshi. 2019. PMID: 30606931 Review. Japanese.
Cited by
-
Transcription profiling of Epstein-Barr virus nuclear antigen (EBNA)-1 expressing cells suggests targeting of chromatin remodeling complexes.PLoS One. 2010 Aug 10;5(8):e12052. doi: 10.1371/journal.pone.0012052. PLoS One. 2010. PMID: 20706582 Free PMC article.
-
Epstein-Barr virus nuclear antigen 1 does not induce lymphoma in transgenic FVB mice.Proc Natl Acad Sci U S A. 2005 Jan 18;102(3):820-5. doi: 10.1073/pnas.0408774102. Epub 2005 Jan 7. Proc Natl Acad Sci U S A. 2005. PMID: 15640350 Free PMC article.
-
Small molecule inhibition of Epstein-Barr virus nuclear antigen-1 DNA binding activity interferes with replication and persistence of the viral genome.Antiviral Res. 2014 Apr;104:73-83. doi: 10.1016/j.antiviral.2014.01.018. Epub 2014 Jan 31. Antiviral Res. 2014. PMID: 24486954 Free PMC article.
-
Epstein-Barr virus-encoded Bcl-2 homologue functions as a survival factor in Wp-restricted Burkitt lymphoma cell line P3HR-1.J Virol. 2010 Mar;84(6):2893-901. doi: 10.1128/JVI.01616-09. Epub 2009 Dec 30. J Virol. 2010. PMID: 20042495 Free PMC article.
-
Epstein-Barr virus provides a survival factor to Burkitt's lymphomas.Proc Natl Acad Sci U S A. 2003 Nov 25;100(24):14269-74. doi: 10.1073/pnas.2336099100. Epub 2003 Nov 5. Proc Natl Acad Sci U S A. 2003. PMID: 14603034 Free PMC article.
References
-
- Kieff E, Rickinson A. In: Field's Virology. Knipe D, Howley P, editors. II. Williams & Wilkins, Philadelphia: Lippincott; 2001. pp. 2511–2574.
-
- Rickinson A, Kieff E. In: Field's Virology. Knipe D, Howley P, editors. II. WIlliams & Wilkins, Philadelphia: Lippincott; 2001. pp. 2575–2628.
-
- Chen H, Smith P, Ambinder R F, Hayward S D. Blood. 1999;93:3026–3032. - PubMed
Publication types
MeSH terms
Substances
Grants and funding
LinkOut - more resources
Full Text Sources
Other Literature Sources
