Comparative Study
. 2001 Dec 4;98(25):14356-61.
doi: 10.1073/pnas.251537298.

Fast dynamics of halophilic malate dehydrogenase and BSA measured by neutron scattering under various solvent conditions influencing protein stability

Affiliations
Comparative Study

Fast dynamics of halophilic malate dehydrogenase and BSA measured by neutron scattering under various solvent conditions influencing protein stability

M Tehei et al. Proc Natl Acad Sci U S A. .

Abstract

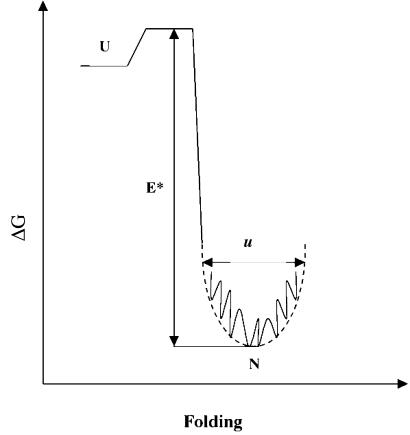
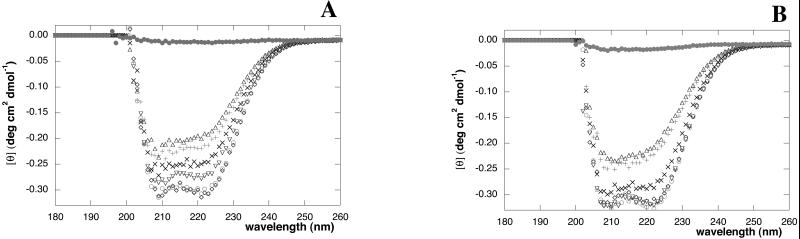
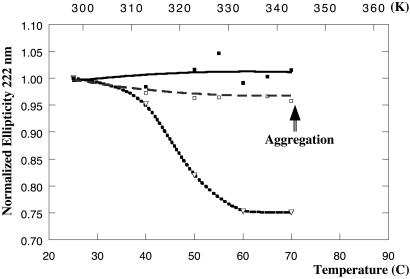
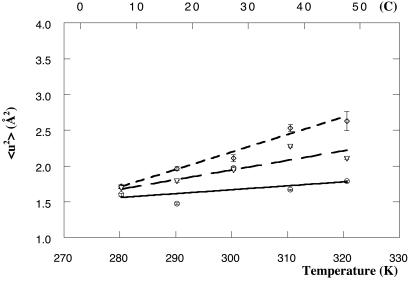
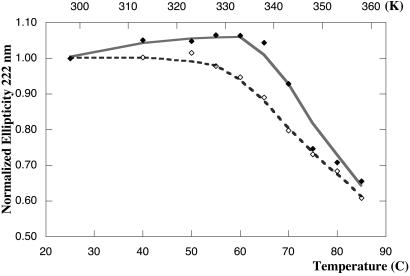
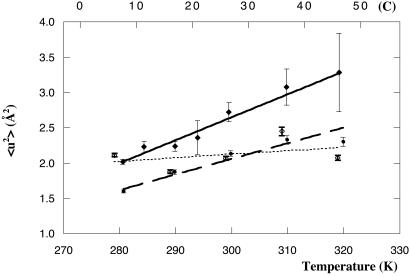
Protein thermal dynamics was evaluated by neutron scattering for halophilic malate dehydrogenase from Haloarcula marismortui (HmMalDH) and BSA under different solvent conditions. As a measure of thermal stability in each case, loss of secondary structure temperatures were determined by CD. HmMalDH requires molar salt and has different stability behavior in H(2)O, D(2)O, and in NaCl and KCl solvents. BSA remains soluble in molar NaCl. The neutron experiments provided values of mean-squared atomic fluctuations at the 0.1 ns time scale. Effective force constants, characterizing the mean resilience of the protein structure, were calculated from the variation of the mean-squared fluctuation with temperature. For HmMalDH, resilience increased progressively with increasing stability, from molar NaCl in H(2)O, via molar KCl in D(2)O, to molar NaCl in D(2)O. Surprisingly, however, the opposite was observed for BSA; its resilience is higher in H(2)O where it is less stable than in D(2)O. These results confirmed the complexity of dynamics-stability relationships in different proteins. Softer dynamics for BSA in D(2)O showed that the higher thermostability is associated with entropic fluctuations. In the halophilic protein, higher stability is associated with increased resilience showing the dominance of enthalpic terms arising from bonded interactions. From previous data, it is suggested that these are associated with hydrated ion binding stabilizing the protein in the high-salt solvent.


Figures

Figure 1
Figure 1
Schematic diagram of free energy (ΔG) vs. folding showing atomic fluctuations u in the native state (N) and activation free energy (E) for secondary structure loss to give the unfolded state (U).
Figure 2
Figure 2
Far-UV CD spectra of BSA recorded at 25°C in 200 mM KCl H2O (A) and 200 mM KCl D2O (B) at pH 8. The protein concentration was 0.5 mg/ml. Spectra obtained after different temperature incubations [25°C (⋄), 55°C (○), 65°C (▿), 70°C (×), 80°C (+), 85°C (▵), and buffer at 25°C (●)] are presented. Experimental details are in Materials and Methods.
Figure 3
Figure 3
Normalized ellipticities at 222 nm plotted as a function of accurate temperature. HmMalDH curves in 2 M NaCl D2O (■), 2 M KCl D2O (□), and 2 M NaCl H2O (▿) at pH 8. HmMalDH samples in 2 M NaCl D2O and in 2 M KCl D2O were aggregated at temperature incubation greater than 70°C. Protein concentrations were 0.5 mg/ml. Experimental details are in Materials and Methods.
Figure 4
Figure 4
Global mean-square fluctuations 〈u2〉 in HmMalDH were calculated from the scattered elastic incoherent intensity and plotted as a function of temperature; mean resilience, which is characterized by an effective force constants, 〈k′〉, was calculated from the slopes of the straight-line fits to the data. The error bars correspond to statistical errors. Experimental details are in Materials and Methods. In 2 M NaCl D2O (○), 2 M KCl D2O (▿), and 2 M NaCl H2O (⋄) at pH 8. Protein concentration was 200 mg/ml. Calculated k′ values were 0.113 ± 0.007 N/m in 2 M NaCl⋅H2O, 0.205 ± 0.04 N/m in 2 M KCl⋅D2O, and 0.505 ± 0.049 N/m in 2 M NaCl⋅D2O.
Figure 5
Figure 5
Normalized ellipticities at 222 nm are plotted as a function of accurate temperature. Experimental details are given in Materials and Methods. BSA curves in 200 mM KCl H2O (⋄) and 200 mM KCl D2O (♦) at pH 8. Protein concentrations were 0.5 mg/ml.
Figure 6
Figure 6
Global mean-square fluctuations 〈u2〉 in BSA were calculated from the scattered elastic incoherent intensity and plotted as a function of accurate temperature; mean resilience, which is characterized by an effective force constants, 〈k′〉, were calculated from the slopes of the straight-line fits to the data. The error bars correspond to statistical errors. Experimental details are in Materials and Methods. In 200 mM KCl H2O (⋄), 200 mM KCl D2O (♦), and 2 M NaCl D2O (●) at pH 8. Protein concentration was 200 mg/ml. Calculated k′ values were 0.085 ± 0.012 N/m in 200 mM KCl D2O, 0.125 ± 0.008 N/m in 2 M NaCl D2O, and 0.55 ± 0.246 N/m in 200 mM KCl H2O.

References

    1. Fitter J, Heberle J. Biophys J. 2000;79:1629–1636. - PMC - PubMed
    1. Sohl J L, Jaswal S S, Agard D A. Nature (London) 1998;395:817–819. - PubMed
    1. Zaccai G. Science. 2000;288:1604–1607. - PubMed
    1. Bu Z, Neumann D A, Lee S H, Brown C M, Engelman D M, Han C C. J Mol Biol. 2000;301:525–536. - PubMed
    1. Bée M. Quasielastic Neutron Scattering: Principles and Applications in Solid State Chemistry, Biology and Materials Science. Philadelphia, PA: Adam Hilger; 1988.

Publication types