. 2001 Dec 4;98(25):14458-63.
doi: 10.1073/pnas.241427398.

Induction of platelet formation from megakaryocytoid cells by nitric oxide

Affiliations

Induction of platelet formation from megakaryocytoid cells by nitric oxide

E Battinelli et al. Proc Natl Acad Sci U S A. .

Abstract

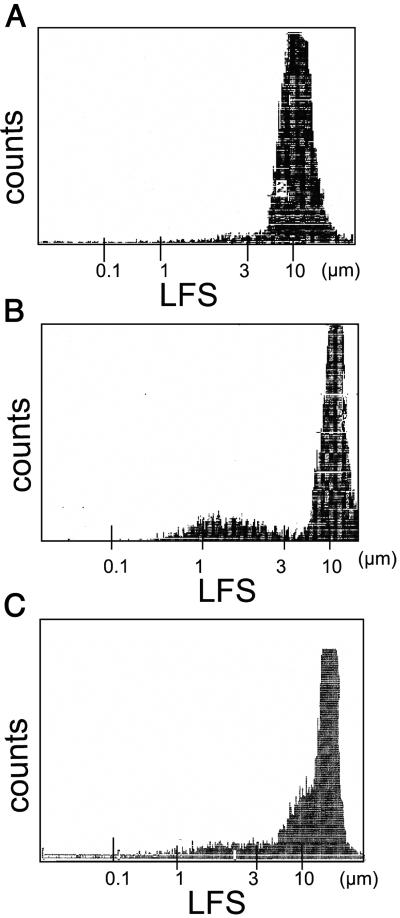
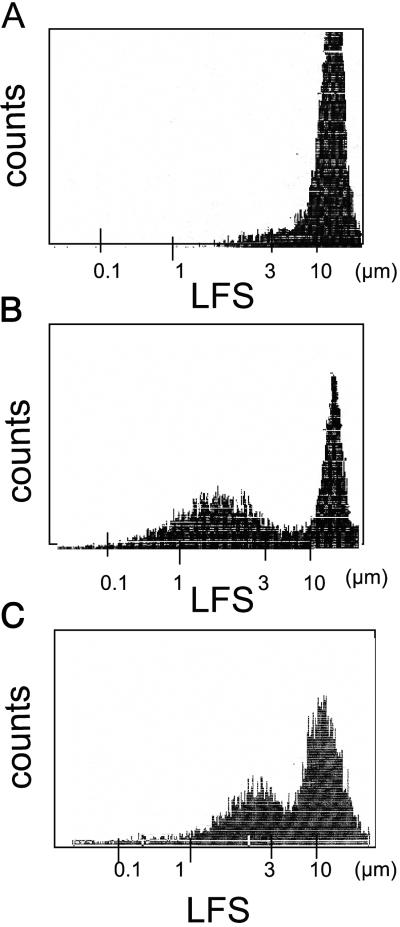
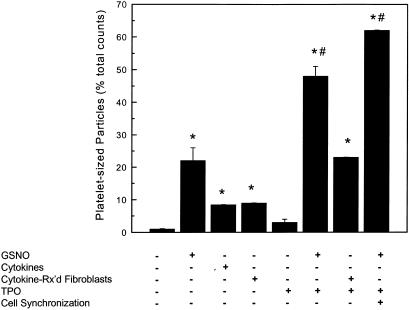
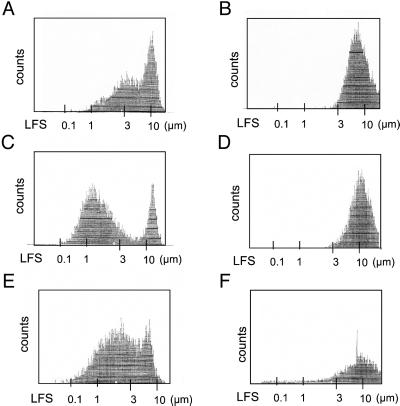
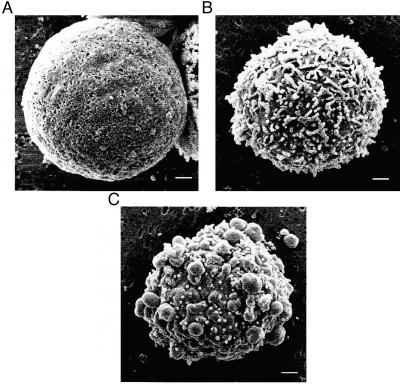
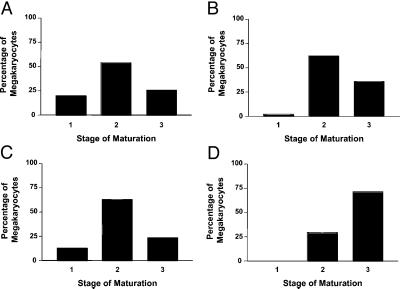
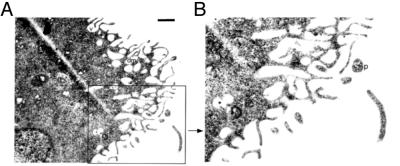
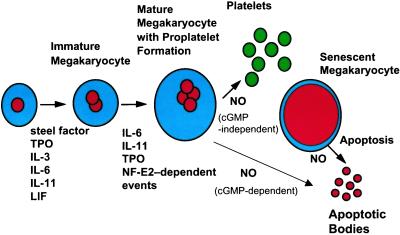
Although the growth factors that regulate megakaryocytopoiesis are well known, the molecular determinants of platelet formation from mature megakaryocytes remain poorly understood. Morphological changes in megakaryocytes associated with platelet formation and removal of senescent megakaryocytes are suggestive of an apoptotic process. Previously, we have established that nitric oxide (NO) can induce apoptosis in megakaryocytoid cell lines. To determine whether there is an association between NO-induced apoptosis and platelet production, we exposed Meg-01 cells to S-nitrosoglutathione (GSNO) with or without thrombopoeitin (TPO) pretreatment and used flow cytometry and electron microscopy to assess platelet-sized particle formation. Meg-01 cells treated with TPO alone produced few platelet-sized particles (<3% of total counts), whereas treatment with GSNO alone produced a significant percentage of platelet-sized particles (22 +/- 4% of total counts); when combined with TPO pretreatment, however, GSNO led to a marked increase in platelet-sized particle production (48 +/- 3% of total counts). Electron microscopy confirmed that Meg-01 cells treated with TPO and GSNO yielded platelet-sized particles with morphological features specific for platelet forms. The platelet-sized particle population appears to be functional, because addition of calcium, fibrinogen, and thrombin receptor-activating peptide led to aggregation. These results demonstrate that NO facilitates platelet production, thereby establishing the essential role of NO in megakaryocyte development and thrombopoiesis.


Figures

Figure 1
Figure 1
Meg-01 cells treated with GSNO. Meg-01 cells were incubated with FITC-conjugated anti-GPIIIa antibody and analyzed by flow cytometry. Data are expressed as a number of events (counts) vs. particle size (LFS, log forward scatter); only those particles that bound the anti-GPIIIa antibody were analyzed. (A) Untreated Meg-01 cells; (B) Meg-01 cells treated with 100 μM GSNO for 2 h showing GPIIIa-positive Meg-01 cells in addition to a population of platelet-sized particles; (1–3 μm) and (C) Meg-01 cells treated with 10 ng/ml of IL-1β, 10 ng/ml of tumor necrosis factor-α, 10 ng/ml of IFN-γ, and endotoxin for 16 h to induce iNOS showing a population of GPIIIa-positive Meg-01 cells in addition to a population of platelet-sized particles.
Figure 2
Figure 2
TPO pretreatment and GSNO-induced platelet-sized particle formation from Meg-01 cells. Data are expressed as a number of events (counts) vs. particle size (LFS, log forward scatter); only those particles that bound the anti-GPIIIa antibody were analyzed. (A) Meg-01 cells were pretreated with 100 ng/ml TPO for 72 h. Cells were labeled with FITC-conjugated GPIIIa-antibody and analyzed by flow cytometry. (B) Meg-01 cells were pretreated with 100 ng/ml TPO for 72 h before addition of 100 μM GSNO for 2 h. An abundant population of GPIIIa-positive platelet-sized particles is visible in addition to the Meg-01 cells. (C) Meg-01 cells were pretreated with TPO and grown in coculture with fibroblasts induced to express iNOS. A population of GPIIIa-positive Meg-01 cells is noted in addition to the large population of platelet-sized particles.
Figure 3
Figure 3
Comparison of treatments used to induce platelet-sized particle formation. Meg-01 cells were treated with 100 μM GSNO for 2 h; treated with cytokines (10 ng/ml of IL-1β, 10 ng/ml of tumor necrosis factor-α, 10 ng/ml of INF-γ, and endotoxin) for 16 h before no additional treatment or GSNO treatment; exposed to cytokine-treated cocultured fibroblasts; treated with 100 ng/ml of TPO for 72 h before no additional treatment, treatment with GSNO, or exposure to cytokine-treated cocultured fibroblasts; or grown in media without FBS for 24 h to induce cell synchronization before treatment with TPO and then GSNO. Each bar represents the results of two to five experiments each performed in duplicate. *, P < 0.02 compared with untreated control; #, P < 0.03 compared with GSNO or TPO treatment alone.
Figure 4
Figure 4
Aggregation of culture-derived platelet-sized particles. Data are expressed as a number of events (counts) vs. particle size (LFS, log forward scatter); only those particles that bound the anti-GPIIIa antibody were analyzed. (A) Culture supernatant of Meg-01 cells treated with GSNO for 2 h collected by centrifugation at 120 × g showing a decreased percentage of megakaryocytoid cells in the culture; (B) culture supernatant incubated with 2.5 mM CaCl2, 1 mg/ml fibrinogen, and 1 mM TRAP showing a shift to the right (larger size) indicating aggregation; (C) culture supernatant of Meg-01 cells treated 100 ng/ml TPO for 72 h before treatment with GSNO for 2 h was collected by centrifugation showing decreased percentage of megakaryocytes in the culture; (D) TPO pretreated culture supernatant incubated with TRAP, calcium, and fibrinogen showing a shift to the right (larger size) indicating aggregation; (E) culture supernatant of Meg-01 cells synchronized and treated with 100 ng/ml TPO for 72 h before treatment with GSNO for 2 h was collected by centrifugation showing decreased percentage of megakaryocytes in the culture; (F) synchronized and TPO-treated culture supernatant incubated with TRAP, calcium, and fibrinogen showing a shift to the right (larger size) indicating aggregation.
Figure 5
Figure 5
Classification of Meg-01 cell maturation by scanning electron microscopy. (A) Meg-01 cells with no pseudopod formation or membrane blebbing (Stage 1); (B) Meg-01 cells with only pseudopod formation (Stage 2); and (C) Meg-01 cells with pseudopod formation, extensive membrane blebbing and distinctive platelet-sized particles (Stage 3). Size marker = 1 μm.
Figure 6
Figure 6
Stage of maturation of Meg-01 cells. (A) Untreated Meg-01 cells; (B) Meg-01 cells treated with 100 μM GSNO for 2 h; (C) Meg-01 cells treated with TPO for 72 h; and (D) Meg-01 cells pretreated with TPO for 72 h before treatment with 100 μM GSNO for 2 h. Cells were scored by an independent reviewer blinded to treatment group according to the classification in Fig. 6. Number of cells counted per group was 100–150.
Figure 7
Figure 7
Transmission electron micrograph of Meg-01 cell. (A) Representative Meg-01 cell showing membrane vacuolization, demarcation membrane formation, and membrane blebbing (size marker 5 μm). (B) Higher magnification showing platelet-sized particles (p) with dense and α-granules.
Figure 8
Figure 8
Determinants of megakaryocytopoiesis and thrombopoiesis. LIF, lymphocyte inhibitory factor.

References

    1. Long M W, Hoffman R. Thrombocytopiesis. New York: Churchill Livingstone; 1995.
    1. Tavassoli M, Aoki M. Blood Cells. 1989;15:3–14. - PubMed
    1. Burstein S A, Breton-Gorius J. Megakaryopoiesis. New York: McGraw–Hill; 1995.
    1. Trowbridge E A, Martin J F, Slater D N. Thromb Res. 1982;28:461–475. - PubMed
    1. Italiano J E, Lecine P, Shivdasani R A, Hartwig J H. J Cell Biol. 1999;147:1299–1312. - PMC - PubMed

Publication types

MeSH terms

LinkOut - more resources