

A likelihood ratio test for evolutionary rate shifts and functional divergence among proteins
- PMID: 11734650
- PMCID: PMC64713
- DOI: 10.1073/pnas.251526398
A likelihood ratio test for evolutionary rate shifts and functional divergence among proteins
Abstract
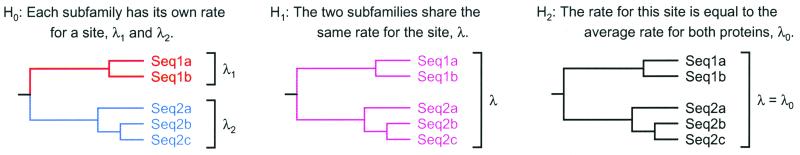
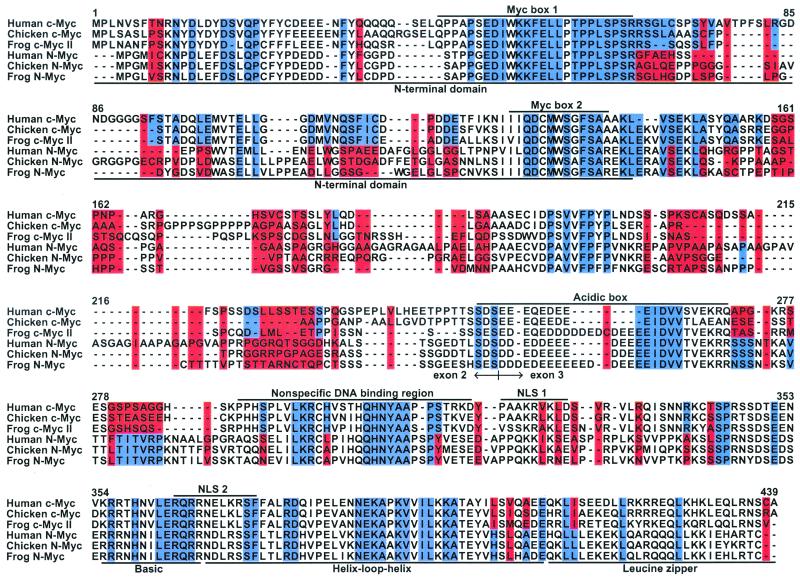
Changes in protein function can lead to changes in the selection acting on specific residues. This can often be detected as evolutionary rate changes at the sites in question. A maximum-likelihood method for detecting evolutionary rate shifts at specific protein positions is presented. The method determines significance values of the rate differences to give a sound statistical foundation for the conclusions drawn from the analyses. A statistical test for detecting slowly evolving sites is also described. The methods are applied to a set of Myc proteins for the identification of both conserved sites and those with changing evolutionary rates. Those positions with conserved and changing rates are related to the structures and functions of their proteins. The results are compared with an earlier Bayesian method, thereby highlighting the advantages of the new likelihood ratio tests.
Figures
Similar articles
-
A simple statistical method for estimating type-II (cluster-specific) functional divergence of protein sequences.Mol Biol Evol. 2006 Oct;23(10):1937-45. doi: 10.1093/molbev/msl056. Epub 2006 Jul 24. Mol Biol Evol. 2006. PMID: 16864604
-
A maximum likelihood method for detecting functional divergence at individual codon sites, with application to gene family evolution.J Mol Evol. 2004 Jul;59(1):121-32. doi: 10.1007/s00239-004-2597-8. J Mol Evol. 2004. PMID: 15383915
-
Understanding missense mutations in the BRCA1 gene: an evolutionary approach.Proc Natl Acad Sci U S A. 2003 Feb 4;100(3):1151-6. doi: 10.1073/pnas.0237285100. Epub 2003 Jan 16. Proc Natl Acad Sci U S A. 2003. PMID: 12531920 Free PMC article.
-
Heterotachy and functional shift in protein evolution.IUBMB Life. 2003 Apr-May;55(4-5):257-65. doi: 10.1080/1521654031000123330. IUBMB Life. 2003. PMID: 12880207 Review.
-
Predicting functional divergence in protein evolution by site-specific rate shifts.Trends Biochem Sci. 2002 Jun;27(6):315-21. doi: 10.1016/s0968-0004(02)02094-7. Trends Biochem Sci. 2002. PMID: 12069792 Review.
Cited by
-
Genomic background predicts the fate of duplicated genes: evidence from the yeast genome.Genetics. 2004 Apr;166(4):1995-9. doi: 10.1534/genetics.166.4.1995. Genetics. 2004. PMID: 15126414 Free PMC article.
-
eShadow: a tool for comparing closely related sequences.Genome Res. 2004 Jun;14(6):1191-8. doi: 10.1101/gr.1773104. Genome Res. 2004. PMID: 15173121 Free PMC article.
-
Structural and Evolutionary Adaptation of NOD-Like Receptors in Birds.Biomed Res Int. 2021 Apr 29;2021:5546170. doi: 10.1155/2021/5546170. eCollection 2021. Biomed Res Int. 2021. PMID: 33997004 Free PMC article.
-
Selectionism and neutralism in molecular evolution.Mol Biol Evol. 2005 Dec;22(12):2318-42. doi: 10.1093/molbev/msi242. Epub 2005 Aug 24. Mol Biol Evol. 2005. PMID: 16120807 Free PMC article.
-
Antarctic fish mitochondrial genomes lack ND6 gene.J Mol Evol. 2007 Nov;65(5):519-28. doi: 10.1007/s00239-007-9030-z. Epub 2007 Oct 23. J Mol Evol. 2007. PMID: 17955154
References
Publication types
MeSH terms
Substances
LinkOut - more resources
Full Text Sources
Other Literature Sources
