Clinical Trial
. 2001 Dec 4;98(25):14565-70.
doi: 10.1073/pnas.251140998.

T cell infiltration of the prostate induced by androgen withdrawal in patients with prostate cancer

Affiliations
Clinical Trial

T cell infiltration of the prostate induced by androgen withdrawal in patients with prostate cancer

M Mercader et al. Proc Natl Acad Sci U S A. .

Abstract

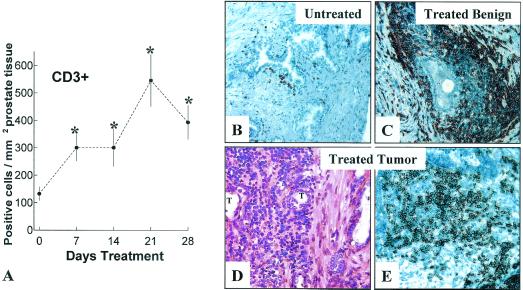
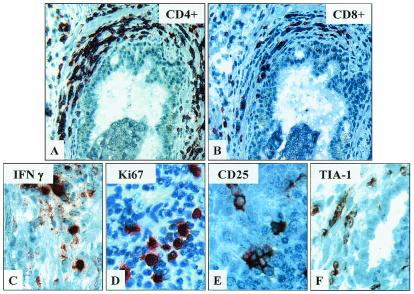
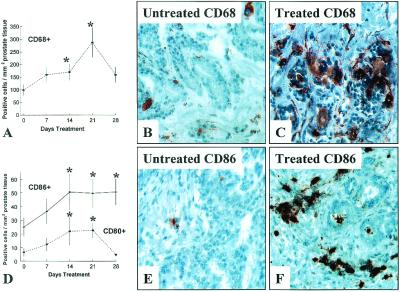
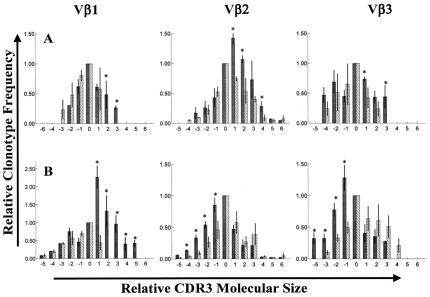
Manipulations capable of breaking host tolerance to induce tissue-specific T cell-mediated inflammation are of central importance to tumor immunotherapy and our understanding of autoimmunity. We demonstrate that androgen ablative therapy induces profuse T cell infiltration of benign glands and tumors in human prostates. T cell infiltration is readily apparent after 7-28 days of therapy and is comprised predominantly of a response by CD4+ T cells and comparatively fewer CD8+ T cells. Also, T cells within the treated prostate exhibit restricted TCR Vbeta gene usage, consistent with a local oligoclonal response. Recruitment/activation of antigen-presenting cells in treated prostate tissues may contribute to local T cell activation. The induction of T cell infiltration in prostate tissues treated with androgen ablation may have implications for the immunotherapeutic treatment of prostate cancer as well as other hormone-sensitive malignancies, including breast carcinoma.


Figures

Figure 1
Figure 1
Androgen ablation induces CD3+ T cell infiltration of the prostate at glandular and intratumoral sites. (A) Plot of CD3+ T cells in prostate tissues from patients treated for 0, 7, 14, 21, or 28 days with androgen ablation. T cells levels within the prostate were quantified as described in Materials and Methods. The vertical axis represents of CD3+ cells per mm2 prostate tissue (mean ± SD). The horizontal axis represents days of treatment. *, P < 0.05, treated tissues compared with untreated (0 day) controls. (B) CD3+ cells within an untreated prostate adjacent to a benign gland. (C) Prominent accumulation of CD3+ cells around a benign gland after 21 days of therapy. (D) H&E section of androgen-ablated tissues reveals profuse mononuclear cell infiltration of tumor sites (T) at 21 days of therapy. (E) Immunochemical staining of similar tumor site reveals intense infiltration by CD3+ cells. (×400.)
Figure 2
Figure 2
T cells infiltrates within treated prostate tissues are comprised predominantly of CD4+ and a lesser amount of CD8+ T cells, including cells exhibiting markers of activation and cytotoxic potential. Immunochemical staining of CD3+ T cell-rich prostate infiltrates within treated prostate tissues demonstrates relatively greater numbers of CD4+ (A) compared with CD8+ T cells (B). Figures are at final ×400. Further staining of these sites reveals moderate numbers of cells expressing activation markers, IFN-γ (C), proliferative marker, Ki67 (D), IL2 receptor, CD25 (E), and cytotoxic granule-associated protein, TIA-1 (F). (×800.)
Figure 3
Figure 3
Androgen ablation induces infiltration of prostate tissues by APCs. Immunochemical staining reveals an increase in numbers of CD68+ macrophages (A) within androgen ablation-treated prostate tissues. CD68+ macrophages in control tissues (B) and prostate tissues treated for 21 days (C). Further staining reveals increased numbers of cells expressing CD80+ (B7.1) and CD86+ (B7.2) within treated prostate tissues (D) relative to untreated control tissues. CD86+ cells in control tissues (E) and prostate tissues treated for 21 days (F). The vertical axes represents mean ± SD of CD68+, CD80+, or CD86+ cells per mm2 of tissue. The horizontal axis represents duration of androgen ablative treatment. *, P < 0.05 for treated tissues compared with untreated (0 day) control tissues. (×400.)
Figure 4
Figure 4
(A and B) Comparison of TCR Vβ clonotype frequencies for prostate-infiltrating and circulating T cells recovered from patients treated with androgen ablative therapy. Histograms in A and B depict the relative frequency of TCR clonotypes (CDR3 products) within Vβ-chain families 1, 2, and 3 for prostate-infiltrating T cells (black bars) relative to patient-matched circulating T cells (hatched bars). Vertical axes represent mean frequencies of Vβ clonotypes (±SD) normalized against a predominant clonotype within each Vβ family for circulating T cells (arbitrarily assigned an x value of 0.0 and y value of 1.0). Horizontal axes represent relative molecular size of CDR3 products within each Vβ family. Data are mean values generated from triplicate assays repeated on three separate occasions. For all histograms, * denotes prostate T cell clonotypes that are significantly increased (P < 0.05) relative to corresponding circulating T cell clonotypes. A demonstrates significant skewing of Vβ spectratypes, relative to circulating T cell spectratypes, for T cells within a single prostate specimen from a representative androgen-ablated subject. B represents averaged Vβ spectratypes for T cells recovered from four widely separated locations (central, anterior, and left and right posterior) within the prostatectomy specimen of a second androgen ablated subject. Fairly concordant patterns of spectratype skewing throughout the prostate are evidenced by the relatively small variation (SD) in individual clonotype frequencies. Similarly, concordant patterns of prostate T cell spectratype skewing for Vβs 1, 2, and/or 3 have also been observed throughout the prostate tissues of 5/5 additional androgen ablated subjects analyzed to date.

References

    1. Andrews G S. J Anat. 1951;85:44–54. - PMC - PubMed
    1. Glenister T W. J Anat. 1962;96:443. - PMC - PubMed
    1. Partin A W, Coffey D S. In: Cambell's Urology. 7th Ed. Walsh P C, Retik A B, Vaughan E D Jr, Wein A J, editors. Philadelphia, PA: Saunders; 1998.
    1. Alexander R B, Brady F, Ponniah S. Urology. 1997;50:893–899. - PubMed
    1. Ponniah S, Arah I, Alexander R B. Prostate. 2000;44:49–54. - PubMed

Publication types

MeSH terms