

Tumour necrosis factor-alpha and leukotriene B(4) mediate the neutrophil migration in immune inflammation
- PMID: 11739237
- PMCID: PMC1572894
- DOI: 10.1038/sj.bjp.0704403
Tumour necrosis factor-alpha and leukotriene B(4) mediate the neutrophil migration in immune inflammation
Abstract
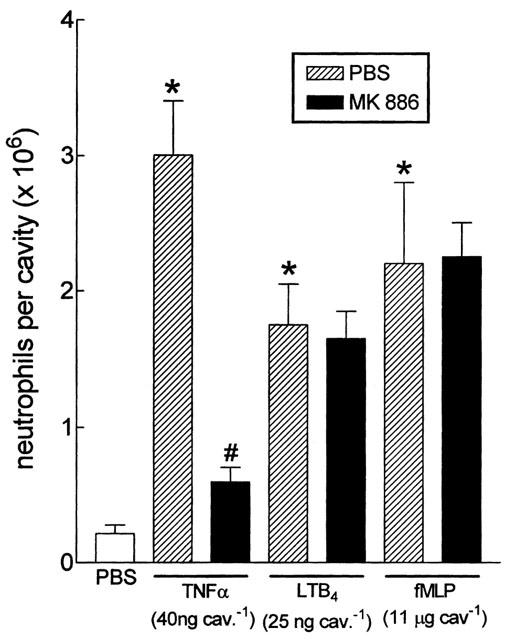
1. We investigated the mediators responsible for neutrophil migration induced by ovalbumin (OVA) in immunized mice and the mechanisms involved in their release. 2. OVA administration promoted dose- and time-dependent neutrophil migration in immunized, but not in non-immunized mice, which was mediated by leukotriene B(4) (LTB(4)) and tumour necrosis factor (TNF)alpha, since it was inhibited by LTB(4) synthesis inhibitor (MK 886) or by LTB(4) receptor antagonist (CP 105,696), by dexamethasone and by antiserum to TNFalpha (82, 85, 63 and 87%, respectively). Confirming TNFalpha involvement, OVA challenge in immunized p55 TNF receptor deficient mice (p55(-/-)) did not promote neutrophil migration (control: 2.90 +/- 0.68; p55(-/-): 0.92+/-0.23 x 10(6) neutrophils cavity(-1)). 3. OVA-stimulated peritoneal cells from immunized mice released a neutrophil chemotactic factor which mimicked, in naive mice, neutrophil migration induced by OVA. 4. Supernatant chemotactic activity is due to TNFalpha and LTB(4), since its release was inhibited by MK 886 (93%) and dexamethasone (90%), and significant amounts of these mediators were detected. 5. TNFalpha and LTB(4) released by OVA challenge seem to act through a sequential mechanism, since MK 886 inhibited (88%) neutrophil migration induced by TNFalpha. Moreover, peritoneal cells stimulated with TNFalpha released LTB(4). 6. CD(4)(+) T cells are responsible for TNFalpha release, because the depletion of this subset prevented the release of TNFalpha (control: 400 +/- 25; immunized: 670 +/- 40; CD(4)(+) depleted: 435 +/- 18 pg ml(-1)). 7. In conclusion, neutrophil migration induced by OVA depends on TNFalpha released by CD(4)(+) cells, which acts through an LTB(4)-dependent mechanism.
Figures


Similar articles
-
MIP-1alpha[CCL3] acting on the CCR1 receptor mediates neutrophil migration in immune inflammation via sequential release of TNF-alpha and LTB4.J Leukoc Biol. 2005 Jul;78(1):167-77. doi: 10.1189/jlb.0404237. Epub 2005 Apr 14. J Leukoc Biol. 2005. PMID: 15831559
-
Neutrophil migration induced by IL-1beta depends upon LTB4 released by macrophages and upon TNF-alpha and IL-1beta released by mast cells.Inflammation. 2008 Feb;31(1):36-46. doi: 10.1007/s10753-007-9047-x. Inflammation. 2008. PMID: 17874178
-
IL-18 enhances collagen-induced arthritis by recruiting neutrophils via TNF-alpha and leukotriene B4.J Immunol. 2003 Jul 15;171(2):1009-15. doi: 10.4049/jimmunol.171.2.1009. J Immunol. 2003. PMID: 12847274
-
Feedback Amplification of Neutrophil Function.Trends Immunol. 2016 Jun;37(6):412-424. doi: 10.1016/j.it.2016.04.002. Epub 2016 May 3. Trends Immunol. 2016. PMID: 27157638 Review.
-
Neutrophil migration in infection and wound repair: going forward in reverse.Nat Rev Immunol. 2016 May 27;16(6):378-91. doi: 10.1038/nri.2016.49. Nat Rev Immunol. 2016. PMID: 27231052 Free PMC article. Review.
Cited by
-
Phlebotomine salivas inhibit immune inflammation-induced neutrophil migration via an autocrine DC-derived PGE2/IL-10 sequential pathway.J Leukoc Biol. 2008 Jul;84(1):104-14. doi: 10.1189/jlb.1107797. Epub 2008 Apr 7. J Leukoc Biol. 2008. PMID: 18390928 Free PMC article.
-
Anti-Inflammatory Benefits of Antibiotics: Tylvalosin Induces Apoptosis of Porcine Neutrophils and Macrophages, Promotes Efferocytosis, and Inhibits Pro-Inflammatory CXCL-8, IL1α, and LTB4 Production, While Inducing the Release of Pro-Resolving Lipoxin A4 and Resolvin D1.Front Vet Sci. 2018 Apr 11;5:57. doi: 10.3389/fvets.2018.00057. eCollection 2018. Front Vet Sci. 2018. PMID: 29696149 Free PMC article.
-
The critical role of leukotriene B4 in antigen-induced mechanical hyperalgesia in immunised rats.Br J Pharmacol. 2003 Jul;139(6):1135-45. doi: 10.1038/sj.bjp.0705346. Br J Pharmacol. 2003. PMID: 12871832 Free PMC article.
-
Endothelin receptors and pain.J Pain. 2009 Jan;10(1):4-28. doi: 10.1016/j.jpain.2008.09.009. J Pain. 2009. PMID: 19111868 Free PMC article. Review.
-
Anti-Inflammatory benefits of antibiotic-induced neutrophil apoptosis: tulathromycin induces caspase-3-dependent neutrophil programmed cell death and inhibits NF-kappaB signaling and CXCL8 transcription.Antimicrob Agents Chemother. 2011 Jan;55(1):338-48. doi: 10.1128/AAC.01052-10. Epub 2010 Oct 18. Antimicrob Agents Chemother. 2011. PMID: 20956586 Free PMC article.
References
-
- ABE T., YOSHIDA K., OMATA T., SEGAWA Y., MATSUDA K., NAGAI H. Effects of ZCR-2060 on allergic airway inflammation and cell activation in guineapigs. J. Pharm. Pharmacol. 1994;46:876–882. - PubMed
-
- AJUEBOR M.N., DAS A.M., VIRAG L., FLOWER R.J., SZABO C., PERRETI M. Role of resident peritoneal macrophages and mast cells in chemokine production and neutrophil migration in acute inflammation: evidence for an inhibitory loop involving endogenous IL-10. J. Immunol. 1999;162:1685–1691. - PubMed
-
- BOCCA A.L., HAYASHI E.E., PINHEIRO A.G., FURLANETTO A.B., CAMPANELLI A.P., CUNHA F.Q., FIGUEIREDO F. Treatment of Paracoccidioides brasiliensis-infected mice with a nitric oxide inhibitor prevents the failure of cell-mediated immune response. J. Immunol. 1998;161:3056–3063. - PubMed
Publication types
MeSH terms
Substances
LinkOut - more resources
Full Text Sources
Molecular Biology Databases
Research Materials
Miscellaneous
