. 2001 Dec 15;21(24):9877-87.
doi: 10.1523/JNEUROSCI.21-24-09877.2001.

Role of calcium, glutamate neurotransmission, and nitric oxide in spreading acidification and depression in the cerebellar cortex

Affiliations

Role of calcium, glutamate neurotransmission, and nitric oxide in spreading acidification and depression in the cerebellar cortex

G Chen et al. J Neurosci. .

Abstract

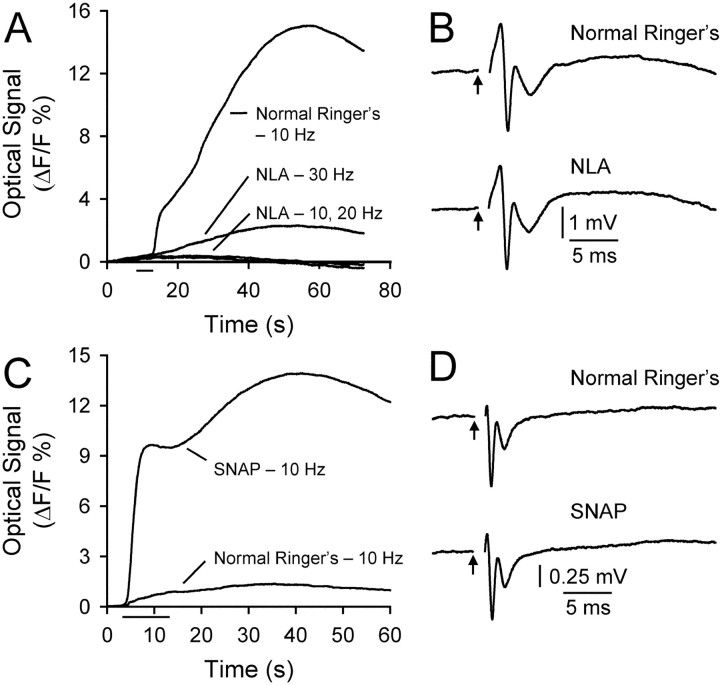
This study investigated the mechanisms underlying the recently reported fast spreading acidification and transient depression in the cerebellar cortex in vivo. Spreading acidification was evoked by surface stimulation in the rat and mouse cerebellar cortex stained with the pH-sensitive dye neutral red and monitored using epifluorescent imaging. The probability of evoking spreading acidification was dependent on stimulation parameters; greater frequency and/or greater amplitude were more effective. Although activation of the parallel fibers defined the geometry of the spread, their activation alone was not sufficient, because blocking synaptic transmission with low Ca(2+) prevented spreading acidification. Increased postsynaptic excitability was also a major factor. Application of either AMPA or metabotropic glutamate receptor antagonists reduced the likelihood of evoking spreading acidification, but stronger stimulation intensities were still effective. Conversely, superfusion with GABA receptor antagonists decreased the threshold for evoking spreading acidification. Blocking nitric oxide synthase (NOS) increased the threshold for spreading acidification, and nitric oxide donors lowered the threshold. However, spreading acidification could be evoked in neuronal NOS-deficient mice (B6;129S-Nos1(tm1plh)). The depression in cortical excitability that accompanies spreading acidification occurred in the presence of AMPA and metabotropic glutamate receptor antagonists and NOS inhibitors. These findings suggest that spreading acidification is dependent on extracellular Ca(2+) and glutamate neurotransmission with a contribution from both AMPA and metabotropic glutamate receptors and is modulated by nitric oxide. Therefore, spreading acidification involves both presynaptic and postsynaptic mechanisms. We hypothesize that a regenerative process, i.e., a nonpassive process, is operative that uses the cortical architecture to account for the high speed of propagation.


Figures

Fig. 1.
Fig. 1.
Propagation of the optical response in Crus IIa and b. A, Series of optical images (stimulation minus background) illustrating the effect of surface stimulation (150 μA, 150 μsec pulses at 10 Hz for 10 sec). The first imageis a background image and also shows the position of the stimulating electrode (see B, C). Numbers are the times in seconds relative to the onset of stimulation. Different time intervals are shown to highlight different aspects of the propagation.B, C, Background images of the folia and the regions of interest (boxes with numbers orletters) at which the fluorescence changes were measured. Boxes were selected to show the propagation parasagittally across the folia in B and transversely within a folium in C. D, Intensity of optical response as percentage of ΔF/F as a function of time for the regions of interest in B. E, Intensity of optical response as percentage of ΔF/Fas a function of time for the regions of interest in C. For this and the following figures, the bar beneath thex-axis denotes time of stimulation. The orientation of the image and scale bar are as indicated.
Fig. 2.
Fig. 2.
Relationship between stimulation parameters and optical electrophysiological responses. A, Effect of stimulation amplitude and frequency on the optical response. Top row, Effect of amplitude. At the same stimulation frequency (10 Hz for 5 sec), when amplitude was changed from 200 to 250 μA, the evoked optical response was enhanced, and at 300 μA, spread was evoked. Note that the decrease in fluorescence at the site of the stimulating electrode is accentuated by increasing stimulation amplitude. Bottom row, Effect of stimulation frequency. Layout is similar to the top row, except that stimulation frequency was varied as indicated. Stimulation amplitude and duration were constant (250 μA and 2 sec). B, Relationship between the probability of evoking spreading acidification and stimulation frequency and amplitude. Data were obtained from 215 experiments in 51 animals in which spread was evoked at some combination of stimulation parameters. C, Effects of stimulation intensities on accumulative field potentials. Normalized accumulative field potentials as a function of stimulation amplitude (top, at 50 Hz) and stimulation frequency (bottom, at 100 μA) are shown.
Fig. 3.
Fig. 3.
Effect of nominally Ca2+-free Ringer's solution (0 Ca2+, 2 mmMg2+, and 2 mm EGTA) on spreading acidification. A, Sequence of images showing the spreading acidification evoked by surface stimulation (200 μA, 15 Hz for 5 sec). B–D, Attempts to evoke spreading acidification in the presence of nominally Ca2+-free Ringer's solution. The results of three different stimulation frequencies are shown. E, After return to normal Ringer's solution, stimulation at 20 Hz evoked spreading acidification. F, Change in fluorescence (ΔF/F) as a function of time for each series. G, Field potential recordings in normal Ringer's solution, nominally Ca2+-free Ringer's solution, and after washout. Arrow, Stimulation onset;gap in the record, stimulus artifact removed.H, Effect of TTX on spreading acidification. In normal Ringer's solution, the spreading acidification is evident but is abolished by the application of TTX (10 μm).
Fig. 4.
Fig. 4.
Effect of glutamate antagonists on spreading acidification. A, Change in fluorescence as a function of time in normal Ringer's solution and in normal Ringer's solution containing 50 μm CNQX. The latter includes series of three stimulation frequencies as indicated. In normal Ringer's solution, spreading acidification was evoked at 20 Hz; after the application of CNQX (50 μm), spreading acidification was evoked at 40 Hz but not 20 or 30 Hz. Stimulation amplitude and duration were kept constant (300 μA, 20 Hz for 10 sec). B, Field potential recordings in normal Ringer's solution and after application of CNQX. C, Similar layout as inA, but MCPG (1 mm) was applied.D, Field potential recordings in normal Ringer's solution and after application of MCPG. E, Similar layout as in A, but a combination of both AMPA and mGluR antagonists was used. These GluR blockers included 20 μmCNQX, 1 mm MCPG, and 1 mm MPPG.F, Field potential recordings in normal Ringer's solution and after application of GluR blockers.
Fig. 5.
Fig. 5.
Effects of GABA blockade on spreading acidification. A, Change in fluorescence as a function of time in normal Ringer's solution and in normal Ringer's solution containing GABA blockers. The same stimulation parameters were used for both conditions (300 μA, 20 Hz for 5 sec). GABA blockers included 100 μm bicuculline and 250 μm saclofen.B, Field potential recordings in normal Ringer's solution and after application of GABA blockers.
Fig. 6.
Fig. 6.
Relationship between NO production and spreading acidification. A, Effect of the NOS inhibitor NLA on spreading acidification. Change in fluorescence is shown as a function of time for series in normal Ringer's solution and in normal Ringer's solution containing 1 mm NLA. The latter includes series of three stimulation frequencies as indicated. In normal Ringer's solution, spreading acidification was evoked at 10 Hz; after the application of NLA, spreading acidification was evoked at 30 Hz but not 10 or 20 Hz. Stimulation amplitude and duration (200 μA, 10 Hz for 5 sec) were kept constant. B, Field potential recordings in normal Ringer's solution and after application of NLA.C, Effect of the NO donor SNAP on spreading acidification. Change in fluorescence is shown as a function of time for series in normal Ringer's solution and in normal Ringer's solution containing 2 mm SNAP. Surface stimulation (300 μA, 20 Hz for 10 sec) produced a strong beam-like optical response but not spreading acidification. After the application of SNAP, spreading acidification was evoked. D, Field potential recordings in normal Ringer's solution and after application of SNAP.
Fig. 7.
Fig. 7.
Effect of AMPA antagonists, mGluR antagonists, and NOS inhibitor on spreading acidification. A, Change in fluorescence as a function of time for series obtained in normal Ringer's solution, in normal Ringer's solution containing the blockers (20 μm CNQX, 2 mm MCPG, and 1 mm NLA), and after washout of the blockers. In normal Ringer's solution, spreading acidification was evoked at 40 Hz; after the application of the blockers, spreading acidification was not evoked even at higher frequencies (50 and 75 Hz) but was again evoked at 40 Hz after washout of the blockers. Stimulation amplitude and duration were kept constant (200 μA, 200 msec, 20 Hz for 5 sec). B, Field potential recordings in normal Ringer's solution and after application of the blockers.
Fig. 8.
Fig. 8.
Spreading acidification evoked in neuronal NOS-deficient mice. A, Sequence of images showing beam-like optical response to surface stimulation (100 μA, 10 Hz for 10 sec) in normal Ringer's solution. B, Sequence of images showing spread evoked in the presence of NLA (1 mm).C, Change in fluorescence as a function of time for each series in A and B.
Fig. 9.
Fig. 9.
Relationship between the optical response and neuronal excitability. In this experiment, the optical response evoked by the first stimulation electrode and field potentials evoked by the second stimulation electrode were simultaneously recorded, as detailed in Materials and Methods. A, Field potentials at selected times (top right corner, in seconds) during spreading acidification. B, Normalized optical signal (ΔF/F) in a 10 × 10 pixel region centered at the tip of the recording electrode and P1-N1 (parallel fiber volley) and N2 (postsynaptic response) as a function of time. The times of field potentials in A are indicated on the plot of the optical signal. C–E, same layout as inB, but the responses were obtained in the presence of CNQX (20 μm), MCPG (1 mm), and NLA (1 mm), respectively. Note that there is no N2component in C, because the postsynaptic response is completely blocked by CNQX.
Fig. 10.
Fig. 10.
Effect of PPADS and furosemide on spreading acidification. A, Change in fluorescence as a function of time for series in normal Ringer's solution and in normal Ringer's solution containing 1 mm PPADS. Surface stimulation: 200 μA, 20 Hz for 2 sec. B, After topical application of 1 mm furosemide for 45 min, spreading acidification could still be evoked by surface stimulation (300 μA, 30 Hz for 10 sec).

Similar articles

Cited by

References

    1. Aitken PG, Tombaugh GC, Turner DA, Somjen GG. Similar propagation of SD and hypoxic SD-like depolarization in rat hippocampus recorded optically and electrically. J Neurophysiol. 1998;80:1514–1521. - PubMed
    1. Ariano MA, Lewicki JA, Brandwein HJ, Murad F. Immunohistochemical localization of guanylate cyclase within neurons of rat brain. Proc Natl Acad Sci USA. 1982;79:1316–1320. - PMC - PubMed
    1. Bahar S, Fayuk D, Somjen GG, Aitken PG, Turner DA. Mitochondrial and intrinsic optical signals imaged during hypoxia and spreading depression in rat hippocampal slices. J Neurophysiol. 2000;84:311–324. - PubMed
    1. Basarsky TA, Duffy SN, Andrew RD, MacVicar BA. Imaging spreading depression and associated intracellular calcium waves in brain slices. J Neurosci. 1998;18:7189–7199. - PMC - PubMed
    1. Batchelor AM, Madge DJ, Garthwaite J. Synaptic activation of metabotropic glutamate receptors in the parallel fibre-Purkinje cell pathway in rata cerebellar slices. Neuroscience. 1994;63:911–915. - PubMed

Publication types

MeSH terms

LinkOut - more resources