Comparative Study
. 2001 Dec 15;21(24):9904-16.
doi: 10.1523/JNEUROSCI.21-24-09904.2001.

Adaptation to temporal contrast in primate and salamander retina

Affiliations
Comparative Study

Adaptation to temporal contrast in primate and salamander retina

D Chander et al. J Neurosci. .

Abstract

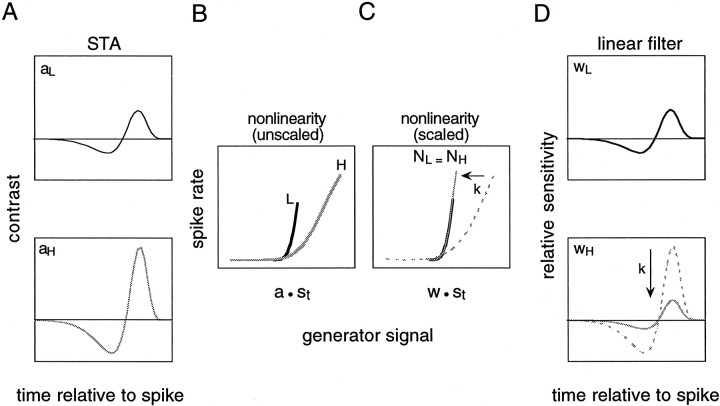
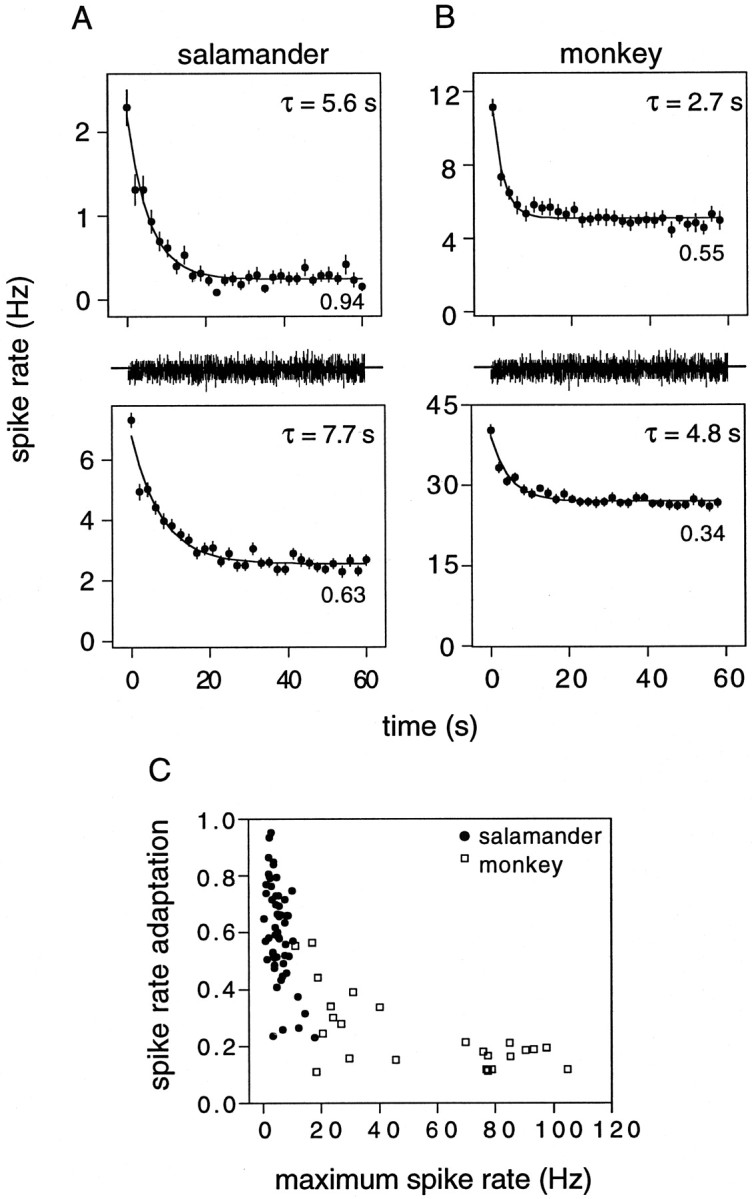
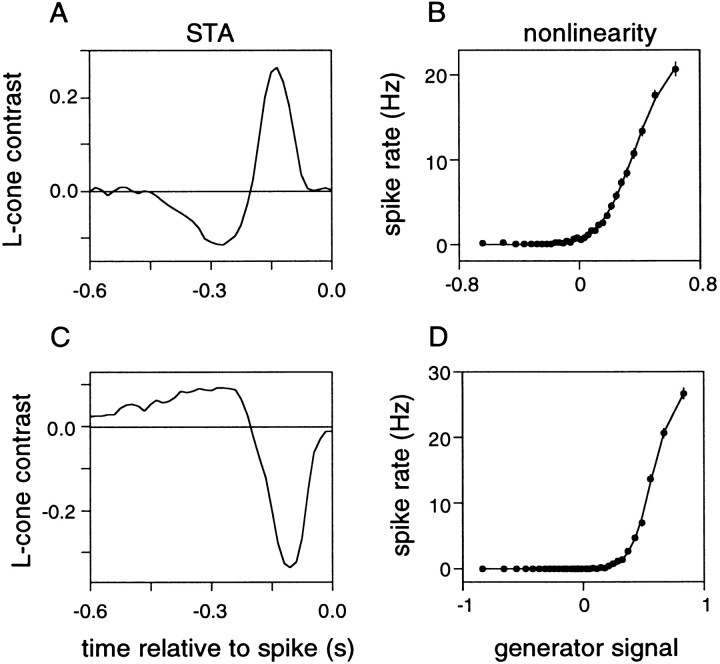
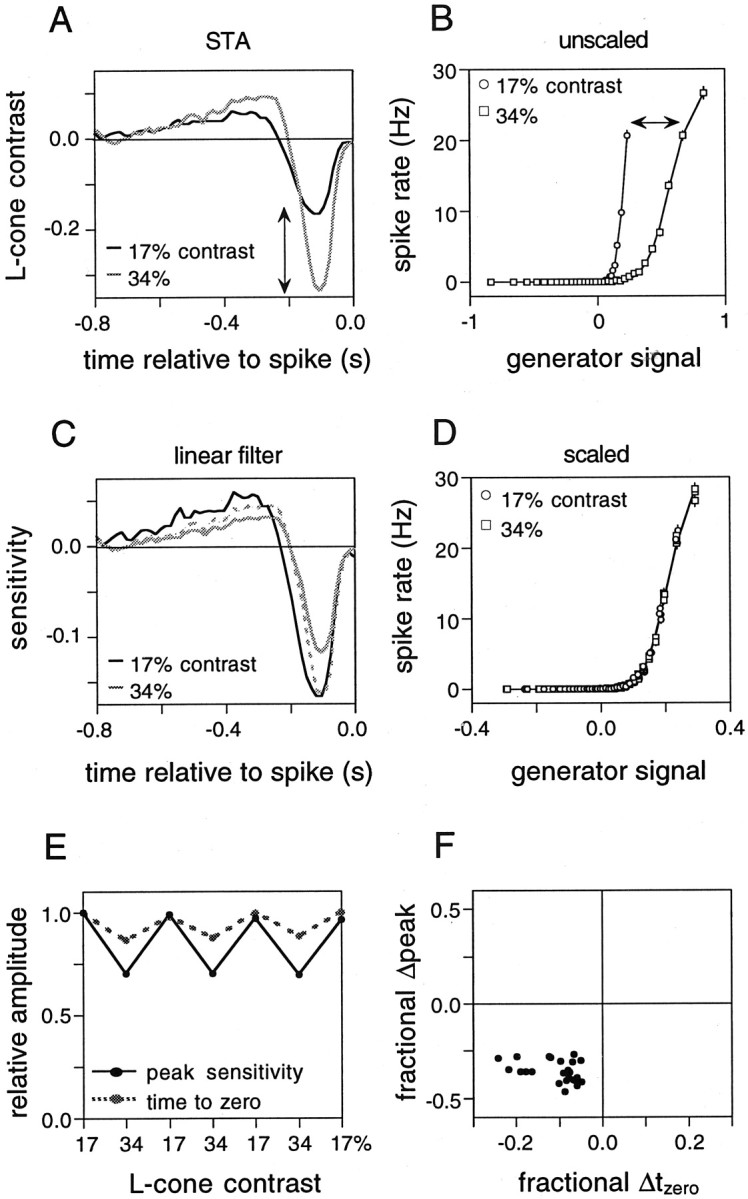
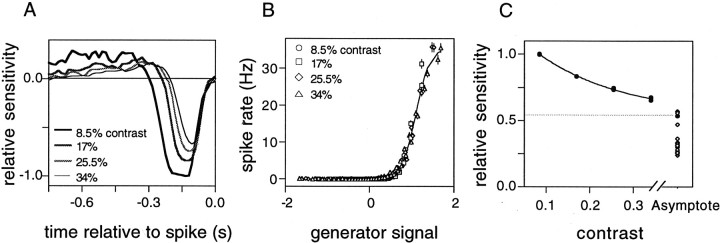
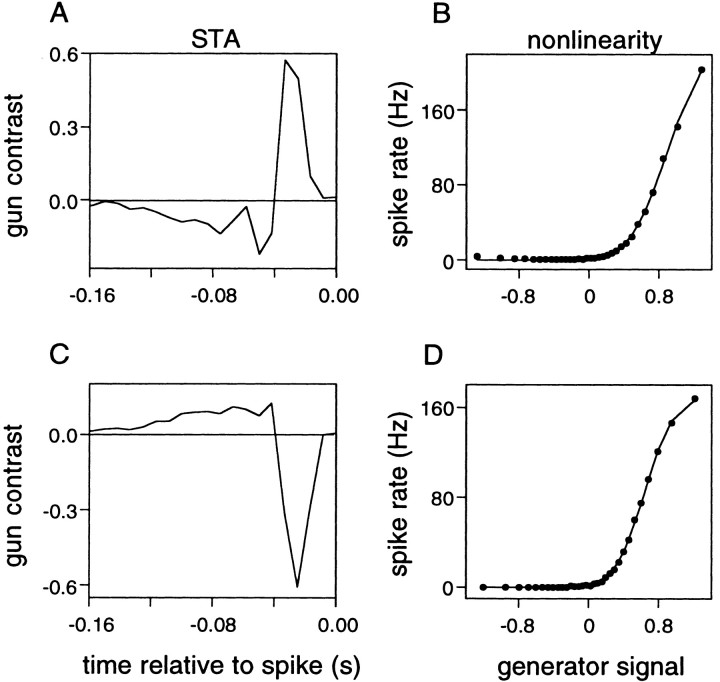
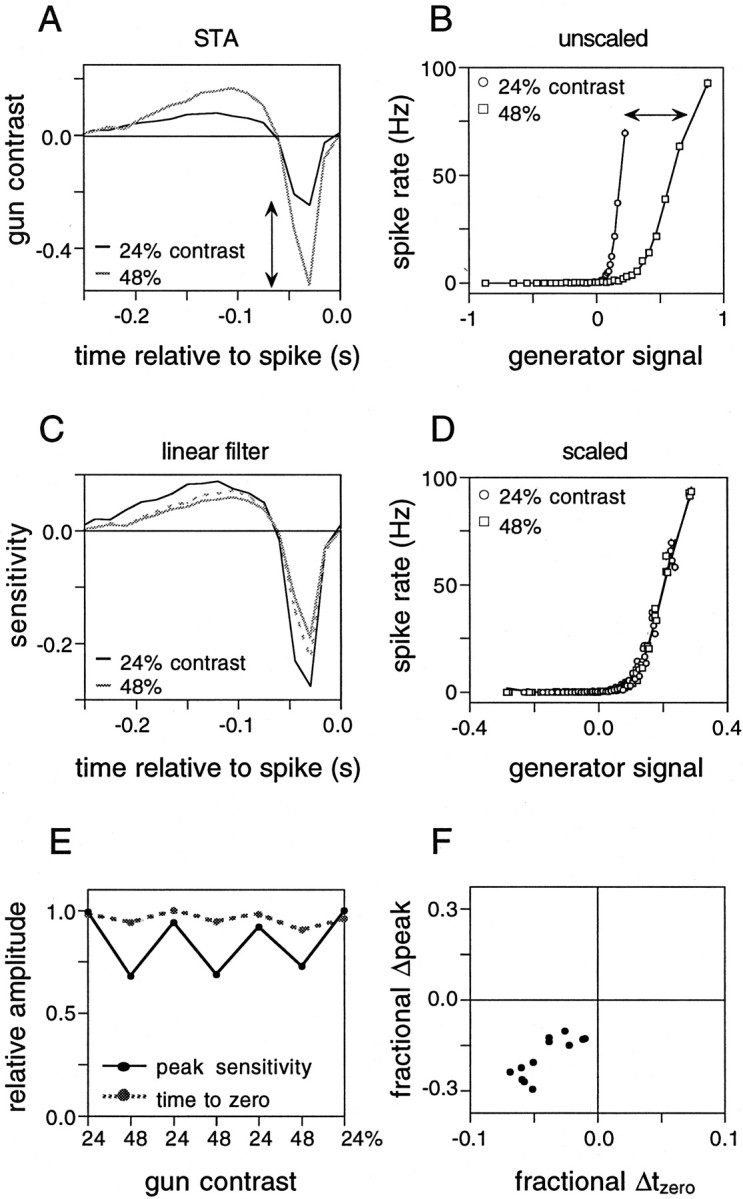
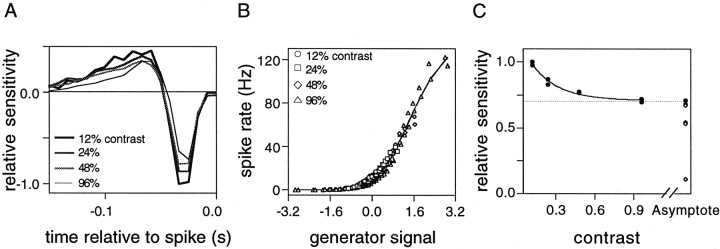
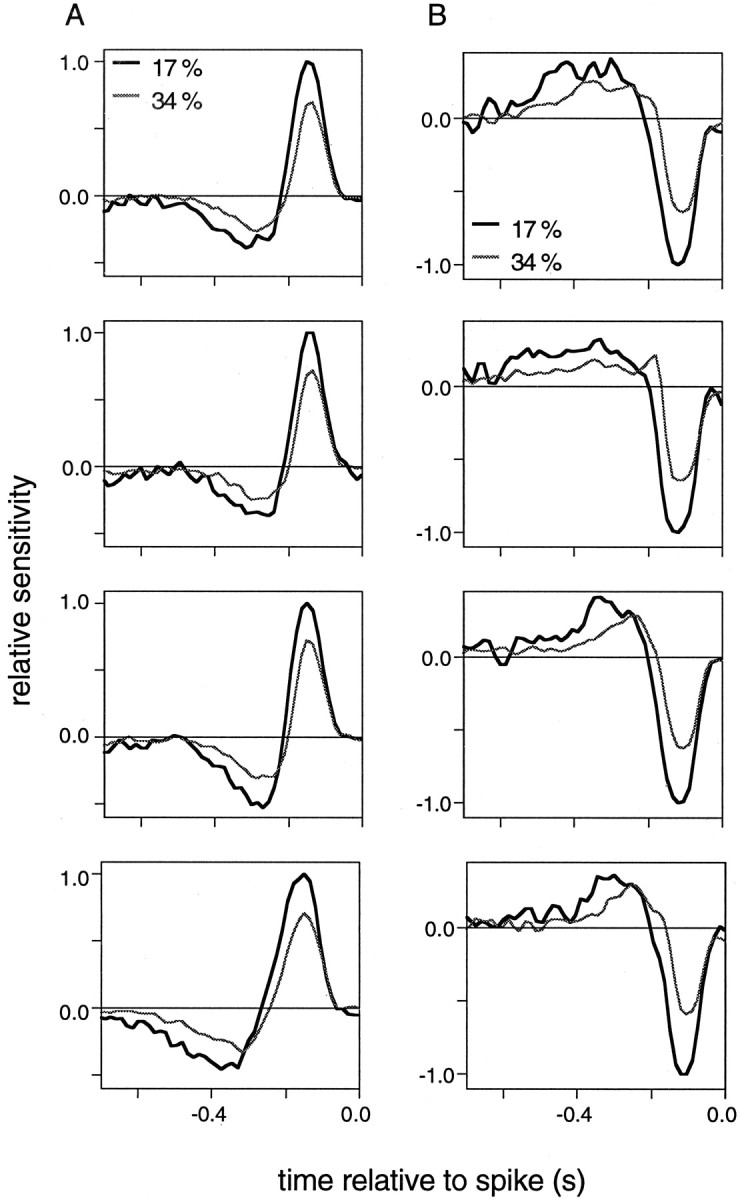
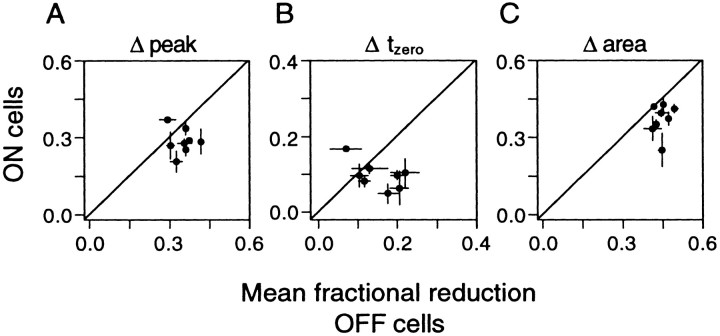
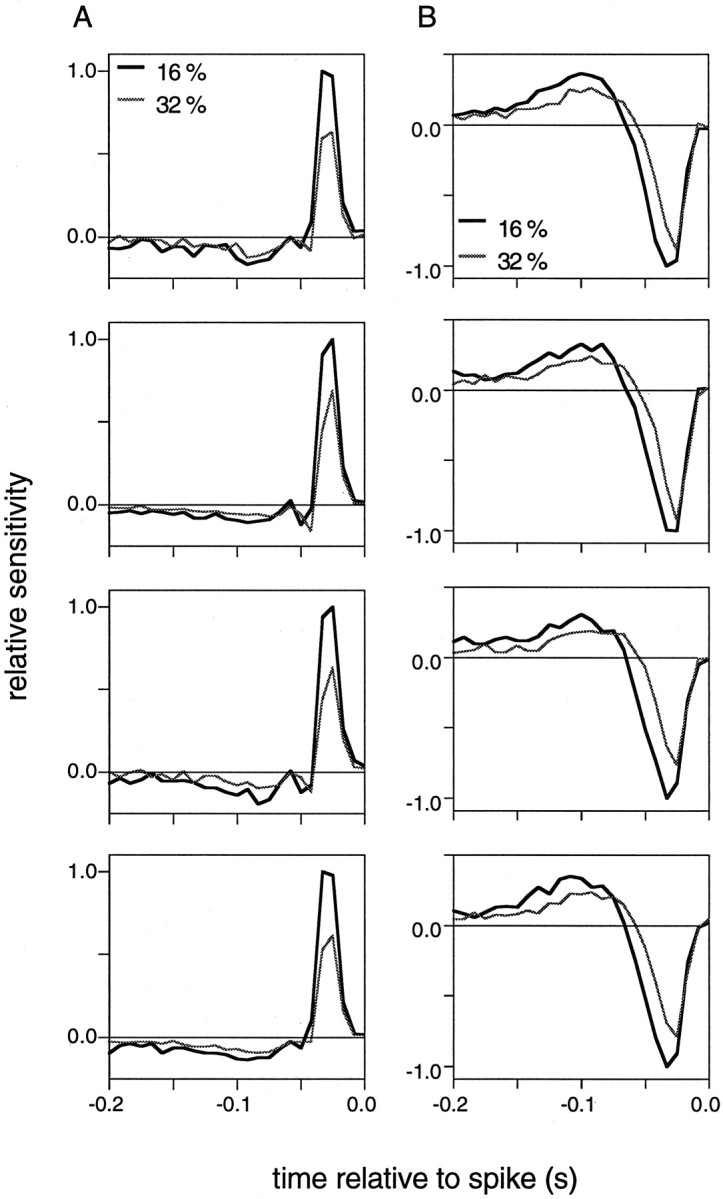
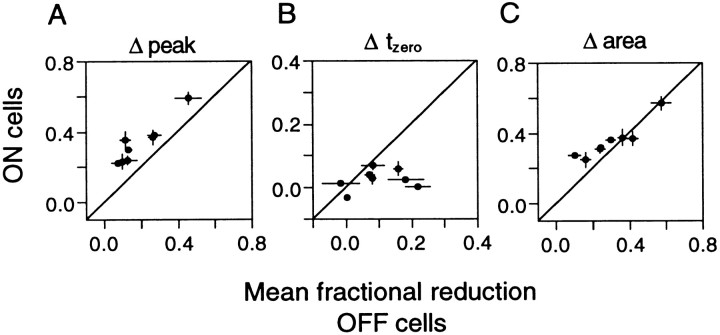
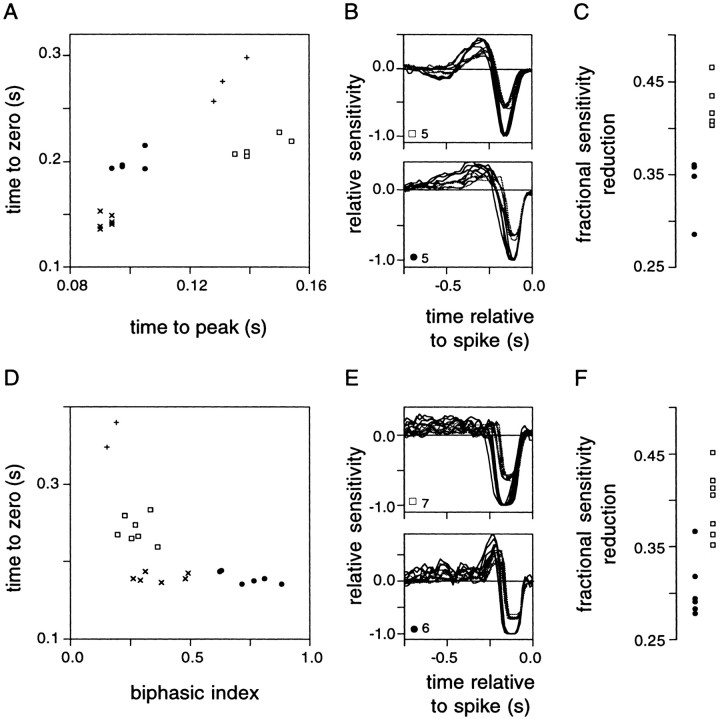
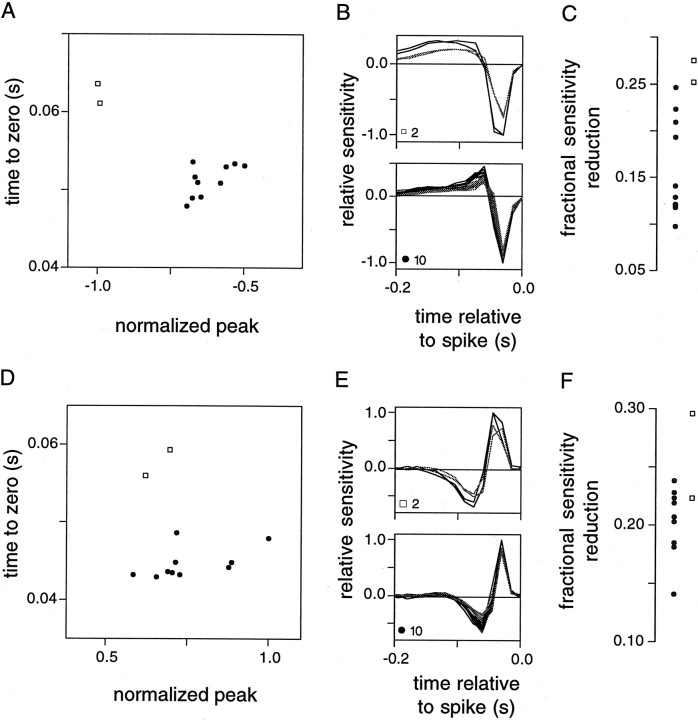
Visual adaptation to temporal contrast (intensity modulation of a spatially uniform, randomly flickering stimulus) was examined in simultaneously recorded ensembles of retinal ganglion cells (RGCs) in tiger salamander and macaque monkey retina. Slow contrast adaptation similar to that recently discovered in salamander and rabbit retina was observed in monkey retina. A novel method was developed to quantify the effect of temporal contrast on steady-state sensitivity and kinetics of light responses, separately from nonlinearities that would otherwise significantly contaminate estimates of sensitivity. Increases in stimulus contrast progressively and reversibly attenuated and sped light responses in both salamander and monkey RGCs, indicating that a portion of the contrast adaptation observed in visual cortex originates in the retina. The effect of adaptation on sensitivity and kinetics differed in simultaneously recorded populations of ON and OFF cells. In salamander, adaptation affected the sensitivity of OFF cells more than ON cells. In monkey, adaptation affected the sensitivity of ON cells more than OFF cells. In both species, adaptation sped the light responses of OFF cells more than ON cells. Functionally defined subclasses of ON and OFF cells also exhibited asymmetric adaptation. These findings indicate that contrast adaptation differs in parallel retinal circuits that convey distinct visual signals to the brain.


Figures

Fig. 1.
Fig. 1.
Model of light responses and estimation of contrast adaptation. A, The STA is computed for the low and high contrast conditions. B, The nonlinear dependence of firing rate on the generator signal (stimulus weighted by STA) is determined for each condition. C, The abscissa of the nonlinearity in high contrast is scaled so that the low and high contrast nonlinearities overlay. D, The same scale factor is applied to the high contrast STA, yielding the high contrast linear filter. The low contrast linear filter is equal to the low contrast STA. Thus changes in sensitivity in low and high contrast are referred to changes in the linear filter.
Fig. 2.
Fig. 2.
Slow contrast adaptation in salamander and monkey RGCs. Top panels show spike rate as a function of time, averaged over multiple trials in which a randomly flickering stimulus began at time 0 and continued for 60 sec. Between trials the retina was exposed to spatially uniform background light of the same mean intensity for approximately 60 sec (data not shown). The random stimulus was different on each trial but had the same time-averaged contrast. A, Spike rate is shown as a function of time for two simultaneously recorded salamander RGCs from a single preparation. Stimulus: 60 trials, 33 Hz binary random flicker, 96% gun contrast.B, Spike rate is shown as a function of time for two simultaneously recorded monkey RGCs from a single preparation. Stimulus: 35 trials, 120 Hz binary random flicker, 96% gun contrast.Insets show time constants and fractional reduction in firing rate obtained from exponential fits. Error bars represent ±1 SEM. C, Fractional reduction in spike rate is shown as a function of maximum spike rate immediately after stimulus onset for cells from four preparations, two salamander (58 cells, ●) and two monkey (28 cells, □).
Fig. 3.
Fig. 3.
Characterization of light response in one ON cell (A, B) and one OFF cell (C,D) simultaneously recorded in salamander retina.A, C, The spike-triggered average L-cone contrast during random flicker stimulation is plotted as a function of time relative to the spike. This is proportional to the linear filtering of recent visual inputs. B, D, Spike rate is shown as a function of the estimated generator signal (stimulus weighted by linear filter), averaged over many time points during stimulation. Vertical (horizontal) error bars indicate the SE of spike rate (generator signal) for each such average; most error bars are smaller than the symbols. Smooth curve is a parametrized form of the cumulative normal distribution, shifted and scaled to fit the data. Stimulus: 33 Hz binary random flicker, 34% L-cone contrast.
Fig. 4.
Fig. 4.
Effect of contrast adaptation on light responses in salamander RGCs.  A, STAs for a single OFF cell obtained with low (17%, black trace) and high (34%, gray trace) contrast stimulation. Stimulus: 33 Hz L-cone binary random flicker. B, Corresponding nonlinearities for low contrast (○) and high contrast (□). Error bars represent ±1 SEM (see Fig.3). C, Linear filters: the low contrast STA, and the high contrast STA scaled by 0.35, are shown with black andgray lines, respectively. The high contrast filter obtained with linear analysis is shown with a dashed gray line. For comparison with the low contrast filter, this was scaled so that its peak divided by the peak of the low contrast filter equals the ratio of the peaks of the high and low contrast filters obtained with linear analysis. D, Superimposed nonlinearities from four repeats of low contrast stimulation, and three repeats of high contrast stimulation with abscissa scaled by 0.35. E, Peak sensitivity (solid black) and time to zero crossing (dashed gray) of the linear filter relative to the first low contrast filter for alternating low and high contrast stimulation.F, Fractional change in peak sensitivity and time to zero (relative to low contrast) for 24 simultaneously recorded cells including the cell in A–E.
Fig. 5.
Fig. 5.
Dependence of sensitivity on contrast.A, Linear filters for one salamander RGC at four stimulus contrasts (8.5, 17, 25.5, and 34%) with decreasing line thickness for higher contrasts; each trace is the average of two stimulus presentations. Stimulus: 33 Hz L-cone binary random flicker.B, Nonlinearities at all four contrasts superimposed. Two repeats at each contrast are shown with separate symbols. Error bars represent ±1 SEM (see Fig. 3). C, Peak sensitivity (relative to low contrast) as a function of contrast. Two repeats at each contrast are shown with separate symbols. Smooth curve represents an exponential decay to an asymptote of 0.54, shown with adashed line and filled symbol. Open symbols represent asymptotic peak sensitivity for 15 of 26 other cells recorded in this preparation.
Fig. 6.
Fig. 6.
Characterization of light response in one ON cell (A, B) and one OFF cell (C,D) simultaneously recorded in monkey retina. A,C, Spike-triggered average gun contrast during random flicker stimulation as a function of time relative to the spike.B, D, Spike rate as a function of the estimated generator signal averaged over many time points during stimulation. Error bars represent ±1 SEM (see Fig. 3). Stimulus refresh rate: 120 Hz binary random flicker, 64% gun contrast.
Fig. 7.
Fig. 7.
Effect of contrast adaptation on light responses in monkey RGCs. A, STAs for a single OFF cell obtained with low (24%, black trace) and high (48%, gray trace) contrast stimulation. Stimulus: 67 Hz Gaussian random flicker. B, Corresponding nonlinearities for low contrast (○) and high contrast (□). Error bars represent ±1 SEM (see Fig.3). C, Linear filters: the low contrast STA, and the high contrast STA scaled by 0.32, are shown with black andgray lines, respectively. The high contrast filter obtained with linear analysis is shown with a dashed gray line (see Fig. 4). D, Superimposed nonlinearities from four repeats of low contrast stimulation, and three repeats of high contrast stimulation with abscissa scaled by 0.32. E, Peak sensitivity (solid black) and time to zero crossing (dashed gray) of the linear filter relative to the first low contrast filter for alternating low and high contrast stimulation.F, Fractional change in peak sensitivity and time to zero (relative to low contrast) for 12 simultaneously recorded cells including the cell in A–E.
Fig. 8.
Fig. 8.
Dependence of sensitivity on contrast.A, Linear filters for one monkey RGC at four stimulus contrasts (12, 24, 48, and 96%) with decreasing line thickness for higher contrasts; each trace is the average of two stimulus presentations. Stimulus: 120 Hz binary random flicker. B, Nonlinearities at all four contrasts superimposed. Two repeats at each contrast are shown with separate symbols. Error bars represent ±1 SEM (see Fig. 3). C, Peak sensitivity (relative to low contrast) as a function of contrast. Two repeats at each contrast are shown with separate symbols. Smooth curve represents an exponential decay to an asymptote of 0.71, shown with a dashed line and filled symbol. Open symbolsrepresent asymptotic peak sensitivity for four of nine other cells recorded in this preparation.
Fig. 9.
Fig. 9.
ON–OFF asymmetry in contrast adaptation, salamander. Linear filters in low (thick, black trace) and high (thin, gray trace) contrast for four ON cells (A) and four OFF cells (B) recorded simultaneously. Stimulus: 33 Hz binary random flicker, 17 and 34% L-cone contrast.
Fig. 10.
Fig. 10.
Pooled ON–OFF asymmetry in contrast adaptation, salamander. A, Mean fractional reduction in peak sensitivity caused by contrast adaptation for all ON cells and OFF cells in eight preparations; diagonal line represents equality. The dominance of points below the diagonal indicates that in most preparations the mean reduction in sensitivity for OFF cells was greater than that for ON cells. B, Mean fractional reduction in time to zero crossing for the same preparations. C, Mean fractional reduction in the integrated area under the primary lobe of the linear filter for the same preparations. Each preparation included 3–8 ON cells and 8–29 OFF cells (usually in a 1:3 ratio), for a total of 38 ON cells and 132 OFF cells. Error bars represent ±1 SEM.
Fig. 11.
Fig. 11.
ON–OFF asymmetry in contrast adaptation, monkey. Linear filters in low (thick, black trace) and high (thin, gray trace) contrast for four ON cells (A) and four OFF cells (B) recorded simultaneously. Stimulus: 120 Hz binary random flicker, 32 and 64% gun contrast.
Fig. 12.
Fig. 12.
Pooled ON–OFF asymmetry in contrast adaptation, monkey. A, Mean fractional reduction in peak sensitivity caused by contrast adaptation for all ON cells and OFF cells in eight preparations. B, Mean fractional reduction in time to zero crossing for the same preparations. C, Mean fractional reduction in the integrated area under the primary lobe of the linear filter for the same preparations. Each preparation included 6–15 ON cells and 3–12 OFF cells, for a total of 76 ON cells and 55 OFF cells. Error bars represent ±1 SEM.
Fig. 13.
Fig. 13.
Asymmetric adaptation in subclasses of salamander OFF cells. A, D, Each scatter plot shows time to zero crossing versus either time to peak or biphasic index (peak of secondary lobe divided by peak of primary lobe) of the low contrast linear filter for all 19 OFF cells in one preparation (A) and all 21 OFF cells in another preparation (D). Distinct clusters identified by eye were assigned unique symbols. B, E, Linear filters for low contrast (black lines) and high contrast (gray lines) of all cells from two of the identified clusters (□, ●), superimposed and scaled relative to the peak value of each low contrast filter. C, F, Fractional reduction in peak sensitivity for cells from both groups, using the same symbols as A and D. Stimulus: 33 Hz binary random flicker, 17 and 34% L-cone contrast.
Fig. 14.
Fig. 14.
Asymmetric adaptation in subclasses of monkey OFF and ON cells. A, D, Each scatter plot shows the time to zero crossing versus the peak of the low contrast linear filter for all 12 OFF cells in one preparation (A) and all 12 ON cells in another preparation (D). Distinct clusters identified by eye were assigned unique symbols. B, E, Linear filters for low contrast (black lines) and high contrast (gray lines) of all cells from each of the identified clusters (□, ●), superimposed and scaled relative to the peak value of each low contrast filter. C, F, Fractional reduction in peak sensitivity for cells from both groups, using the same symbols as A and D. Stimulus: 67 Hz Gaussian random flicker, 12 and 24% contrast.

References

    1. Albrecht DG, Farrar SB, Hamilton DB. Spatial contrast adaptation characteristics of neurones recorded in the cat's visual cortex. J Physiol (Lond) 1984;347:713–739. - PMC - PubMed
    1. Anstis S. Adaptation to peripheral flicker. Vision Res. 1996;36:3479–3485. - PubMed
    1. Baccus S, Meister M. Mechanisms of contrast adaptation in the retina. Soc Neurosci Abstr. 2000;26:1328.
    1. Benardete EA, Kaplan E. The dynamics of primate m retinal ganglion cells. Vis Neurosci. 1999;16:355–368. - PubMed
    1. Benardete EA, Kaplan E, Knight BW. Contrast gain control in the primate retina: P cells are not X-like, some M cells are. Vis Neurosci. 1992;8:483–486. - PubMed

Publication types

LinkOut - more resources